Fig. 15
Download original image
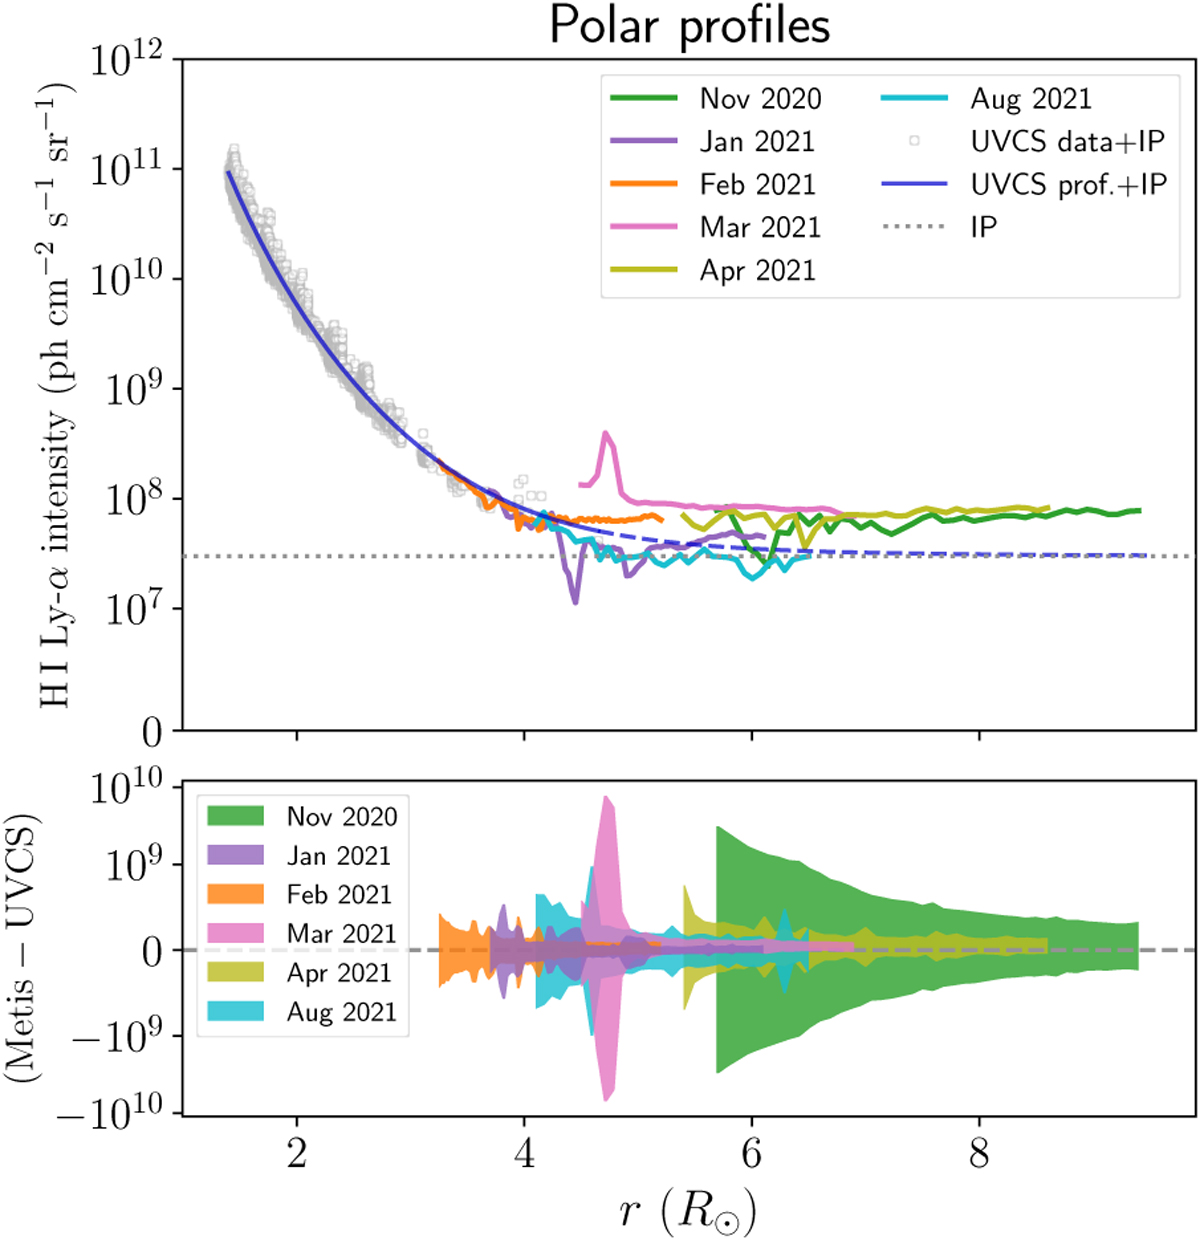
Same as Fig. 14, but for polar radial profiles of Metis and UVCS. Top panel: UVCS data and intensity profile obtained for polar observations and summed with the contribution of the interplanetary H I Ly-α line intensity (IP, dotted line) are depicted as gray circles and blue solid line, respectively. The dashed blue line shows the extrapolation of the UVCS profile up to 9.5 R⊙ for comparison. Bottom panel: symmetrical logarithmic scale of the vertical axis for better visualization; i.e., it is logarithmic in both the negative and positive directions with a linear scale between −109 and 109 photons cm−2 s−1 sr−1.
Current usage metrics show cumulative count of Article Views (full-text article views including HTML views, PDF and ePub downloads, according to the available data) and Abstracts Views on Vision4Press platform.
Data correspond to usage on the plateform after 2015. The current usage metrics is available 48-96 hours after online publication and is updated daily on week days.
Initial download of the metrics may take a while.