Open Access
Fig. 6
Download original image
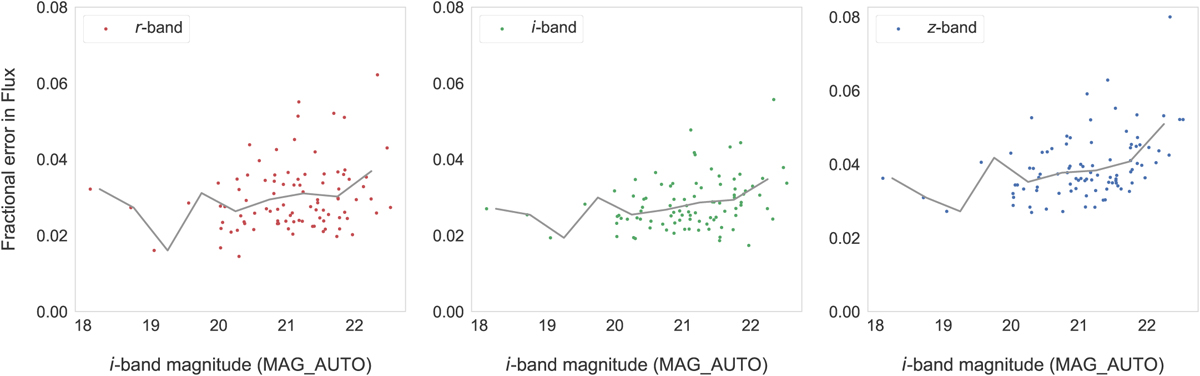
Fractional error in the output flux as a function of the i-band magnitude (which is chosen in order to have the same scale on the x-axis). The dots correspond to the individual galaxies, and the gray line is the best-fit line after binning the magnitude values.
Current usage metrics show cumulative count of Article Views (full-text article views including HTML views, PDF and ePub downloads, according to the available data) and Abstracts Views on Vision4Press platform.
Data correspond to usage on the plateform after 2015. The current usage metrics is available 48-96 hours after online publication and is updated daily on week days.
Initial download of the metrics may take a while.