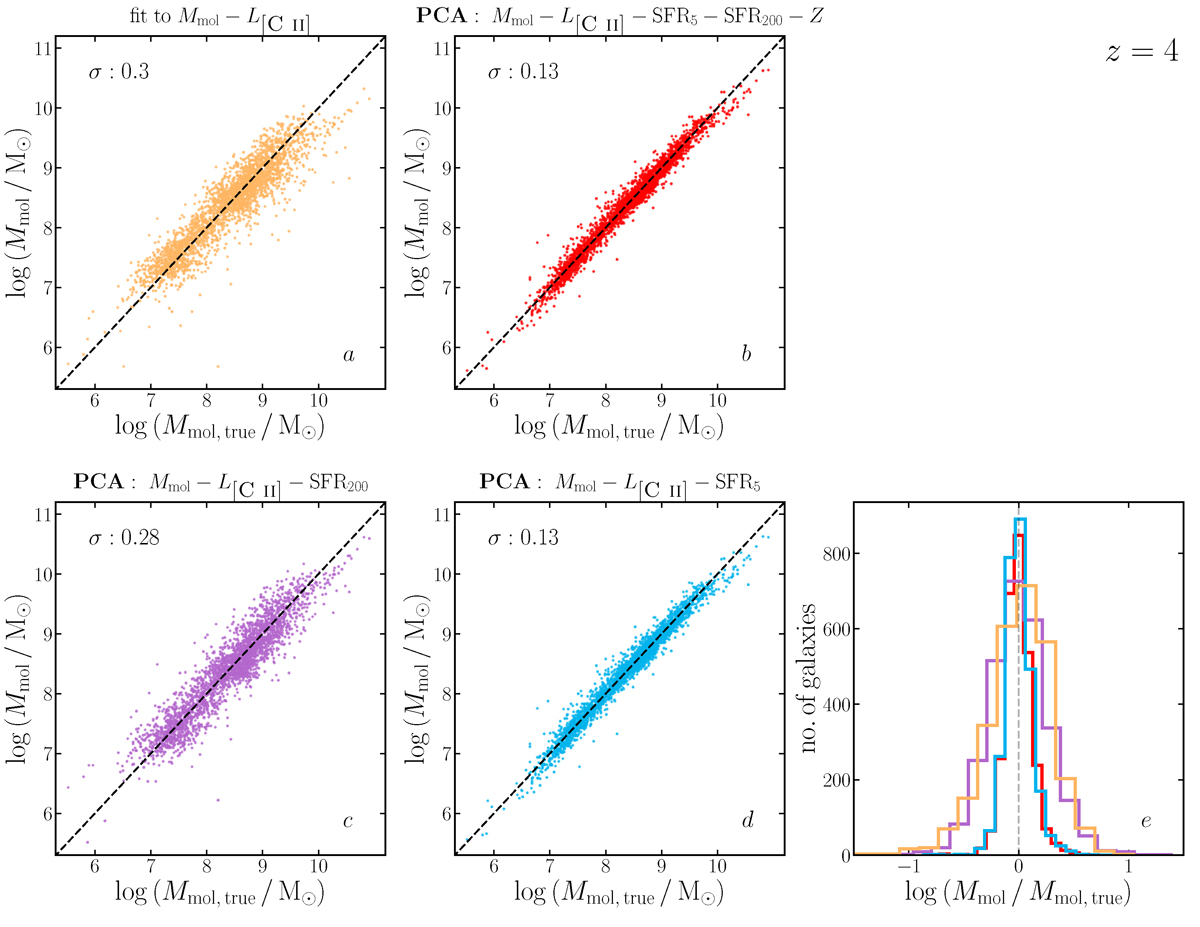
Fig. 12.
Download original image
Comparison of the predicted molecular gas mass estimates with the true molecular gas mass using two different approaches for simulated galaxies at z = 4. Panel a shows the performance of the best-fit relation between Mmol and L[C II], while panels b–d present results from different PCA-based relations (as indicated in the title of each panel). The corresponding relations are listed in Table 5. In panels a–d, the top-left corner reports σ, the standard deviation of the offset between the predicted and true Mmol (both in log scale). Panel e compares the distributions of these offsets from the different approaches.
Current usage metrics show cumulative count of Article Views (full-text article views including HTML views, PDF and ePub downloads, according to the available data) and Abstracts Views on Vision4Press platform.
Data correspond to usage on the plateform after 2015. The current usage metrics is available 48-96 hours after online publication and is updated daily on week days.
Initial download of the metrics may take a while.