Fig. 9.
Download original image
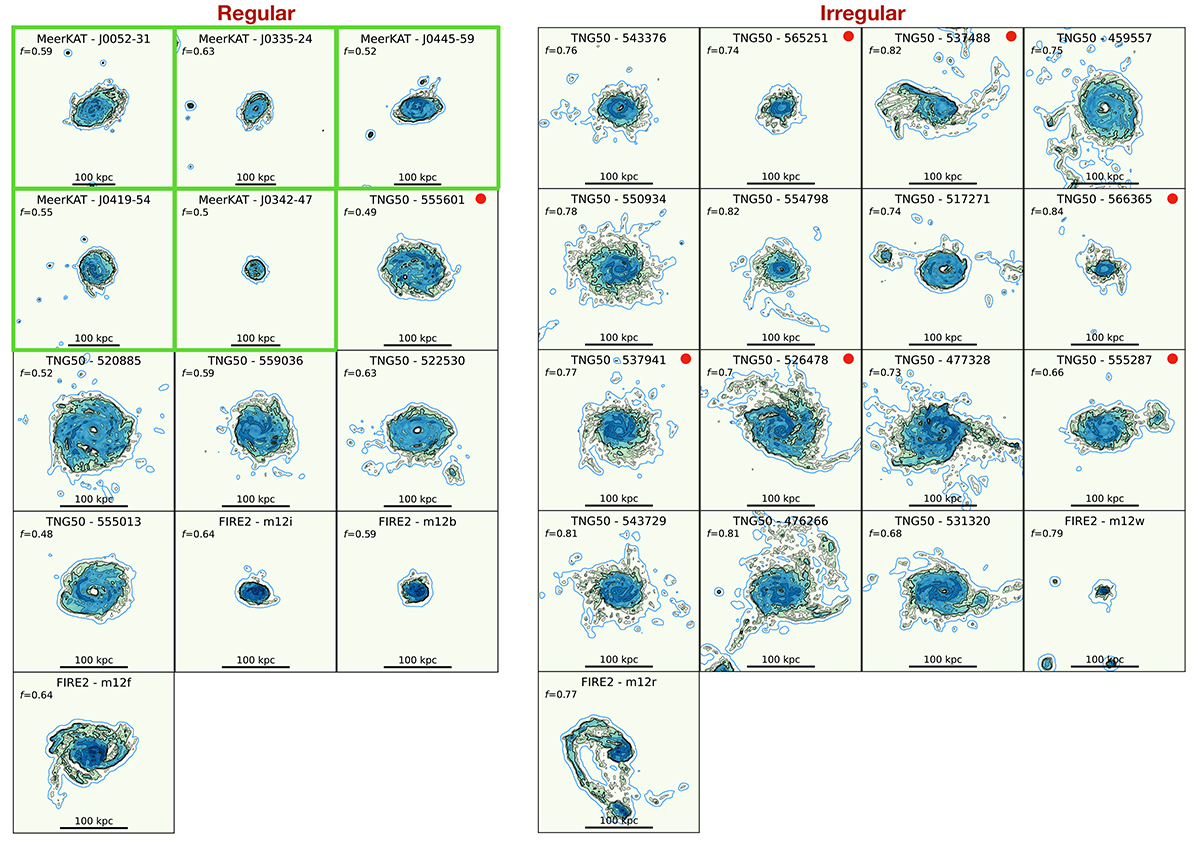
Moment-0 maps for all galaxies in our sample divided into regular (on the left) and irregular (on the right), depending on whether the fraction f of spaxels with H I column density below 1020 cm−2 is higher or lower than 0.65 (see Fig. 8). f values of individual galaxies are annotated in each panel. The red dots mark TNG50 galaxies that have AGN feedback in thermal mode. The black iso-contours from the HR maps are drawn at levels of 1019, 1020 (thicker line), 1020.5, and 1021 cm−2. An additional iso-contour from the LR maps at 1018 cm−2 is shown in blue. The green boxes highlight galaxies observed with MeerKAT. The maps were derived with SoFia-2, using the same parameters for all galaxies.
Current usage metrics show cumulative count of Article Views (full-text article views including HTML views, PDF and ePub downloads, according to the available data) and Abstracts Views on Vision4Press platform.
Data correspond to usage on the plateform after 2015. The current usage metrics is available 48-96 hours after online publication and is updated daily on week days.
Initial download of the metrics may take a while.