Fig. 3.
Download original image
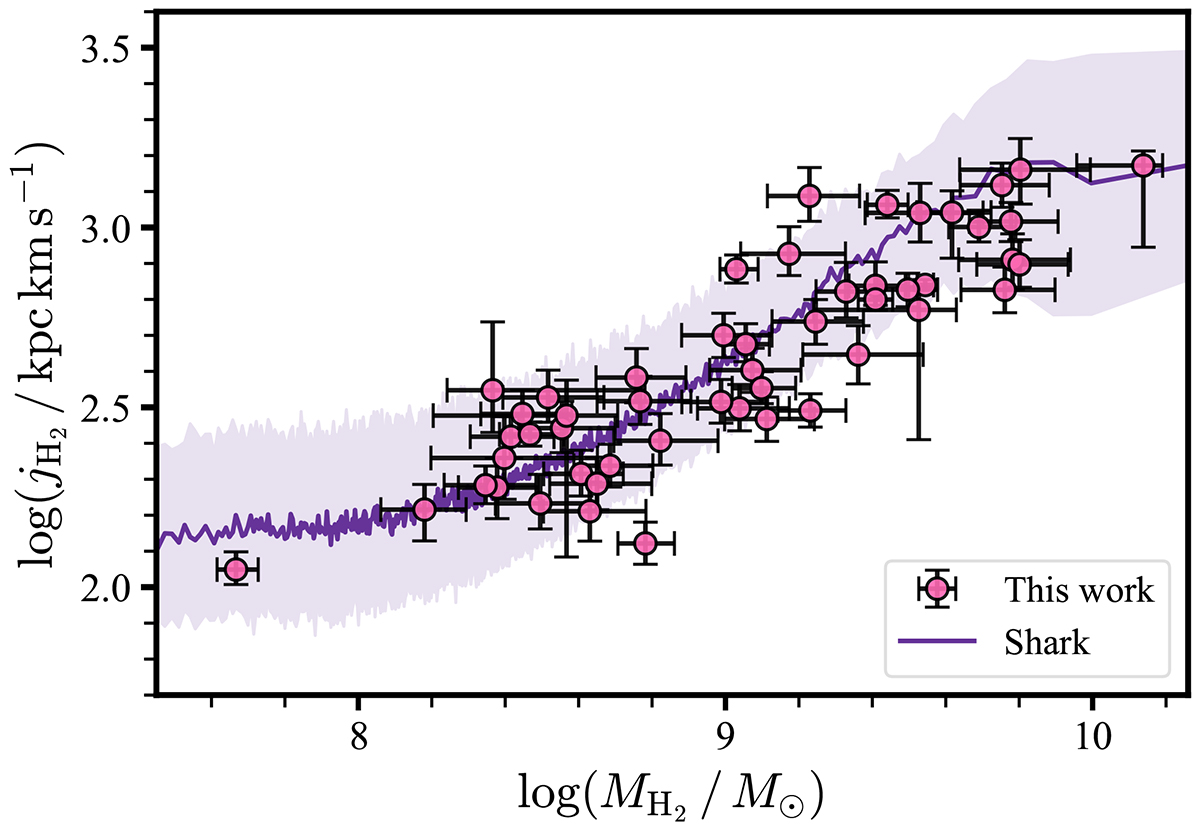
Comparison between our measured jH2 − MH2 relation and the prediction of the SHARK semi-analytical model (version 2.0). The SHARK sample was selected to include galaxies with M* and B/T in the range of the observational data. The median distribution of SHARK is shown with a solid curve, and the 1σ uncertainty is given by the purple band.
Current usage metrics show cumulative count of Article Views (full-text article views including HTML views, PDF and ePub downloads, according to the available data) and Abstracts Views on Vision4Press platform.
Data correspond to usage on the plateform after 2015. The current usage metrics is available 48-96 hours after online publication and is updated daily on week days.
Initial download of the metrics may take a while.