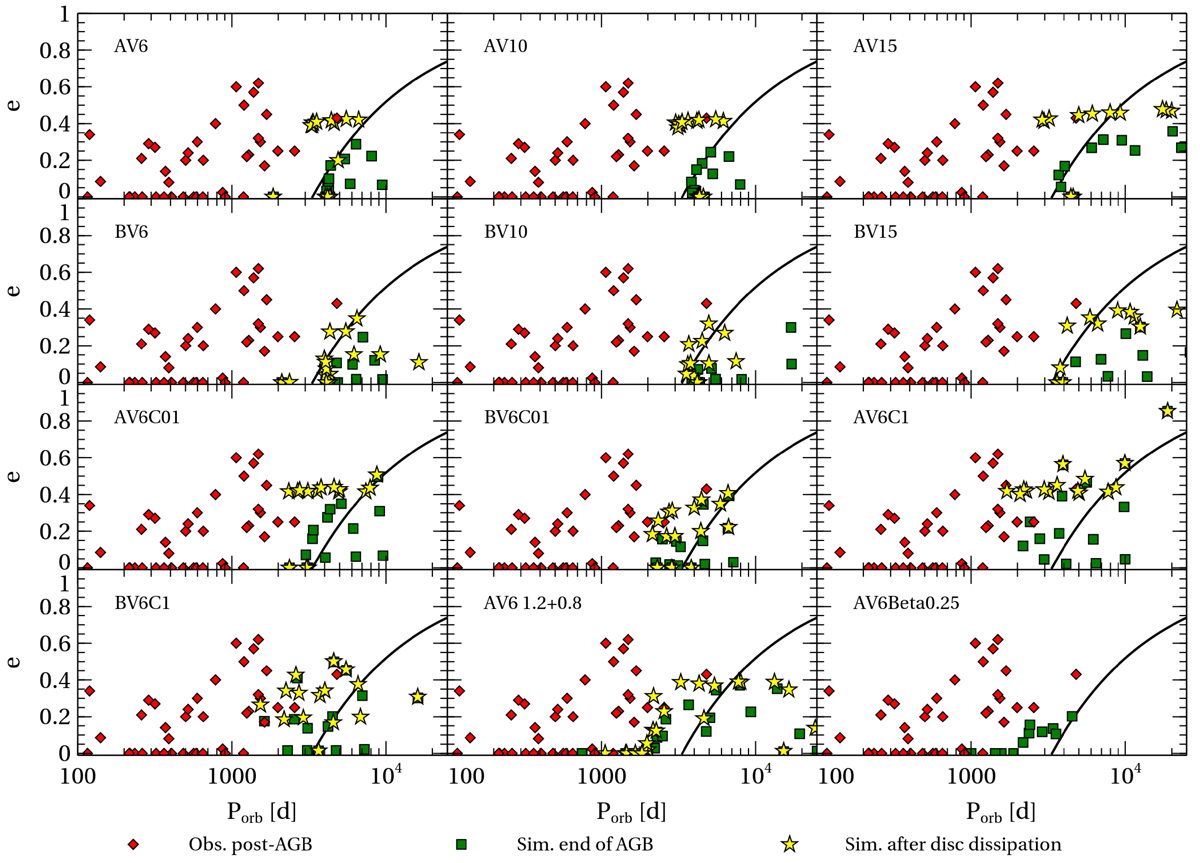
Fig. 12.
Download original image
Comparison of the final orbital parameters obtained in our simulations with observed post-AGB orbital elements (red diamonds; see Sect. 4.1 for references of the data). Each panel corresponds to a different model. Green squares correspond to the orbits of the simulated systems at the end of the AGB phase. During the subsequent post-AGB phase, the CB disk continues to act until its dissipation, producing final orbits represented by yellow star symbols.
Current usage metrics show cumulative count of Article Views (full-text article views including HTML views, PDF and ePub downloads, according to the available data) and Abstracts Views on Vision4Press platform.
Data correspond to usage on the plateform after 2015. The current usage metrics is available 48-96 hours after online publication and is updated daily on week days.
Initial download of the metrics may take a while.