Fig. 3.
Download original image
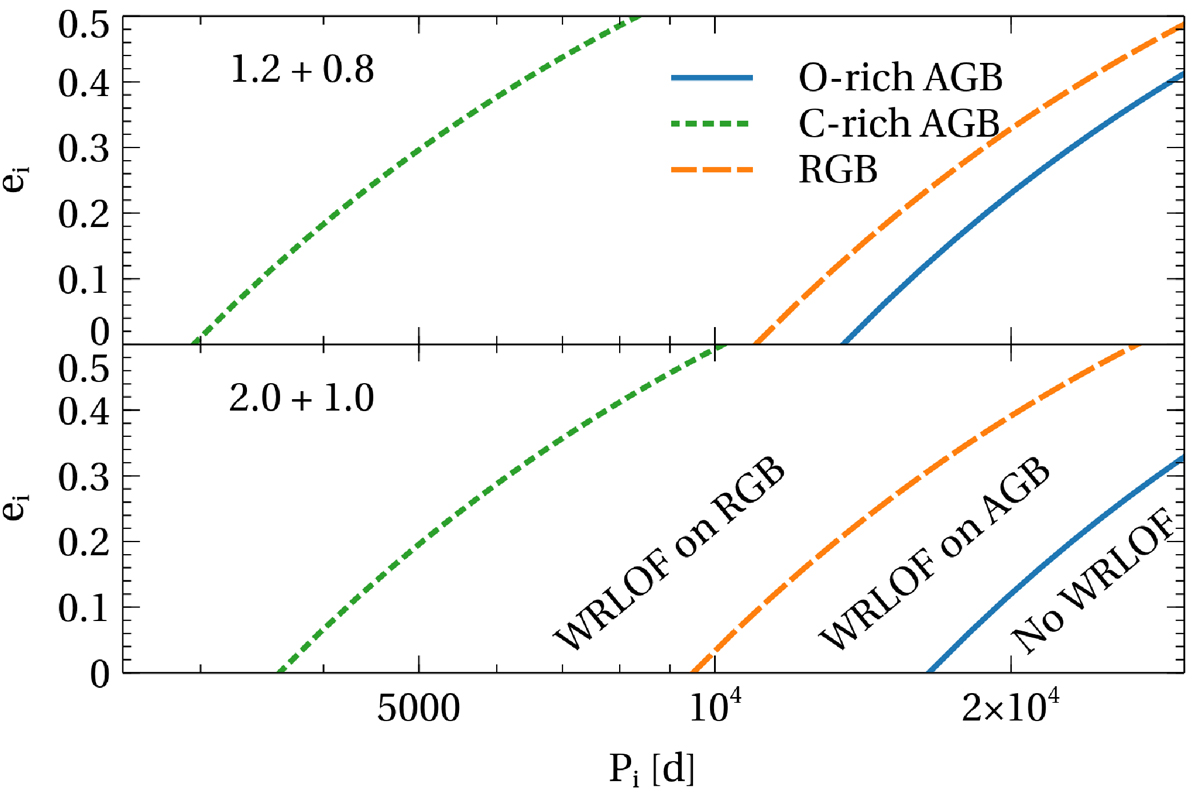
Regions in the e−log P diagram where WRLOF is active. If the initial period Pi of a system lies to the left of the curve, a binary undergoes WRLOF during the RGB (orange dashed line), the AGB (solid blue line), or the AGB with C-rich dust (i.e. Tdust = 1500 K, green short-dashed line). Top and bottom panels refer to 1.2 + 0.8 M⊙ and 2.0 + 1.0 M⊙ binaries, respectively. The orange dashed curve and solid blue curve are computed using Tdust = 1000 K (i.e. O-rich dust).
Current usage metrics show cumulative count of Article Views (full-text article views including HTML views, PDF and ePub downloads, according to the available data) and Abstracts Views on Vision4Press platform.
Data correspond to usage on the plateform after 2015. The current usage metrics is available 48-96 hours after online publication and is updated daily on week days.
Initial download of the metrics may take a while.