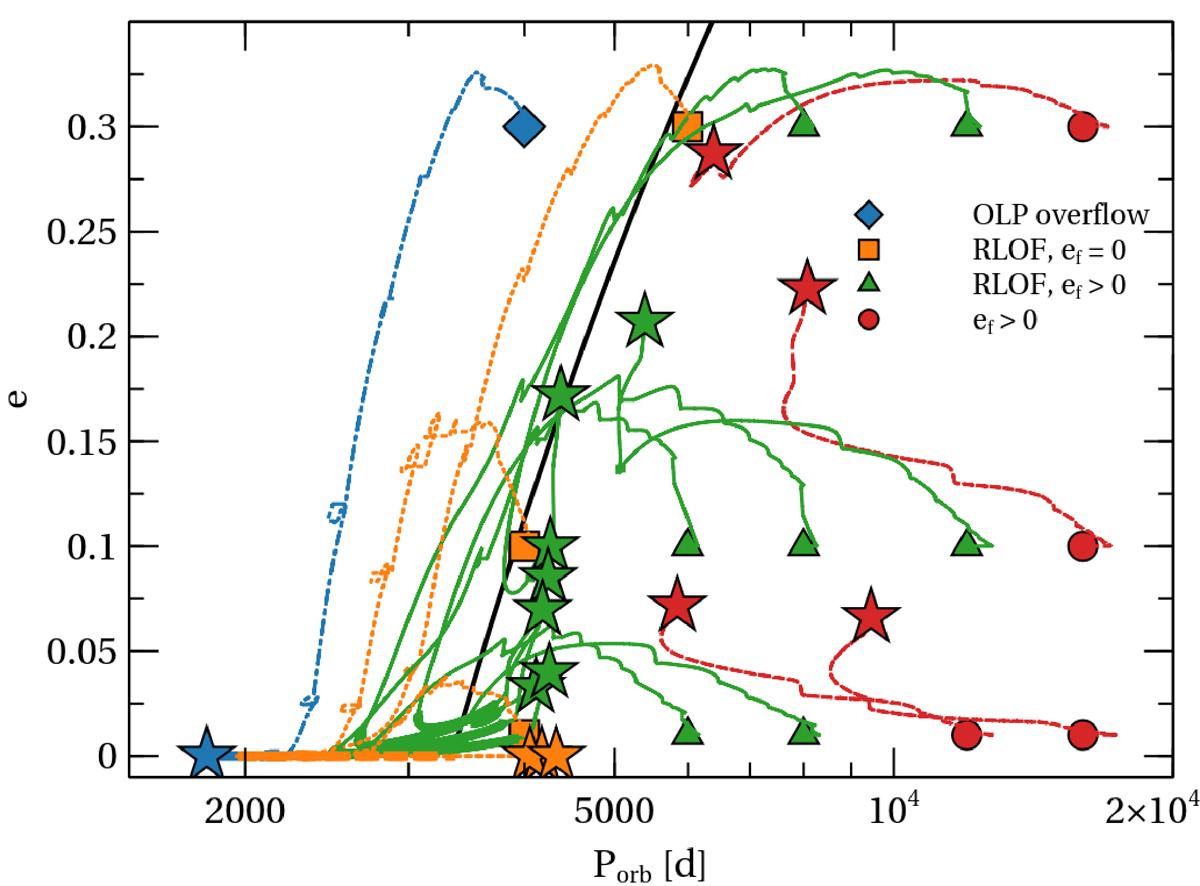
Fig. 6.
Download original image
Evolution in the e−log P diagram of the 2.0+1.0 binaries using parameter set AV6. The color of the points refers to the outcome for the system at the end of the simulation. Red represents eccentric final orbits (ef>0), green represents the same, but with the added condition that the binary undergoes RLOF. Orange corresponds to binaries that experienced RLOF, but ended up on a circular orbit. Star symbols show the final orbital parameters. The blue track identifies systems where the AGB radius exceeds the outer Lagrangian point (OLP), at which point, marked by the blue star, the simulation is stopped. The orbital evolution of binaries is illustrated with an evolutionary track, where the thickness of the line increases once the RLOF starts. The solid black line corresponds to orbital parameters such that a 1 M⊙ primary at the tip of the AGB (having a radius of 350 R⊙) fills its Roche lobe, assuming a 1 M⊙ companion.
Current usage metrics show cumulative count of Article Views (full-text article views including HTML views, PDF and ePub downloads, according to the available data) and Abstracts Views on Vision4Press platform.
Data correspond to usage on the plateform after 2015. The current usage metrics is available 48-96 hours after online publication and is updated daily on week days.
Initial download of the metrics may take a while.