Fig. 5.
Download original image
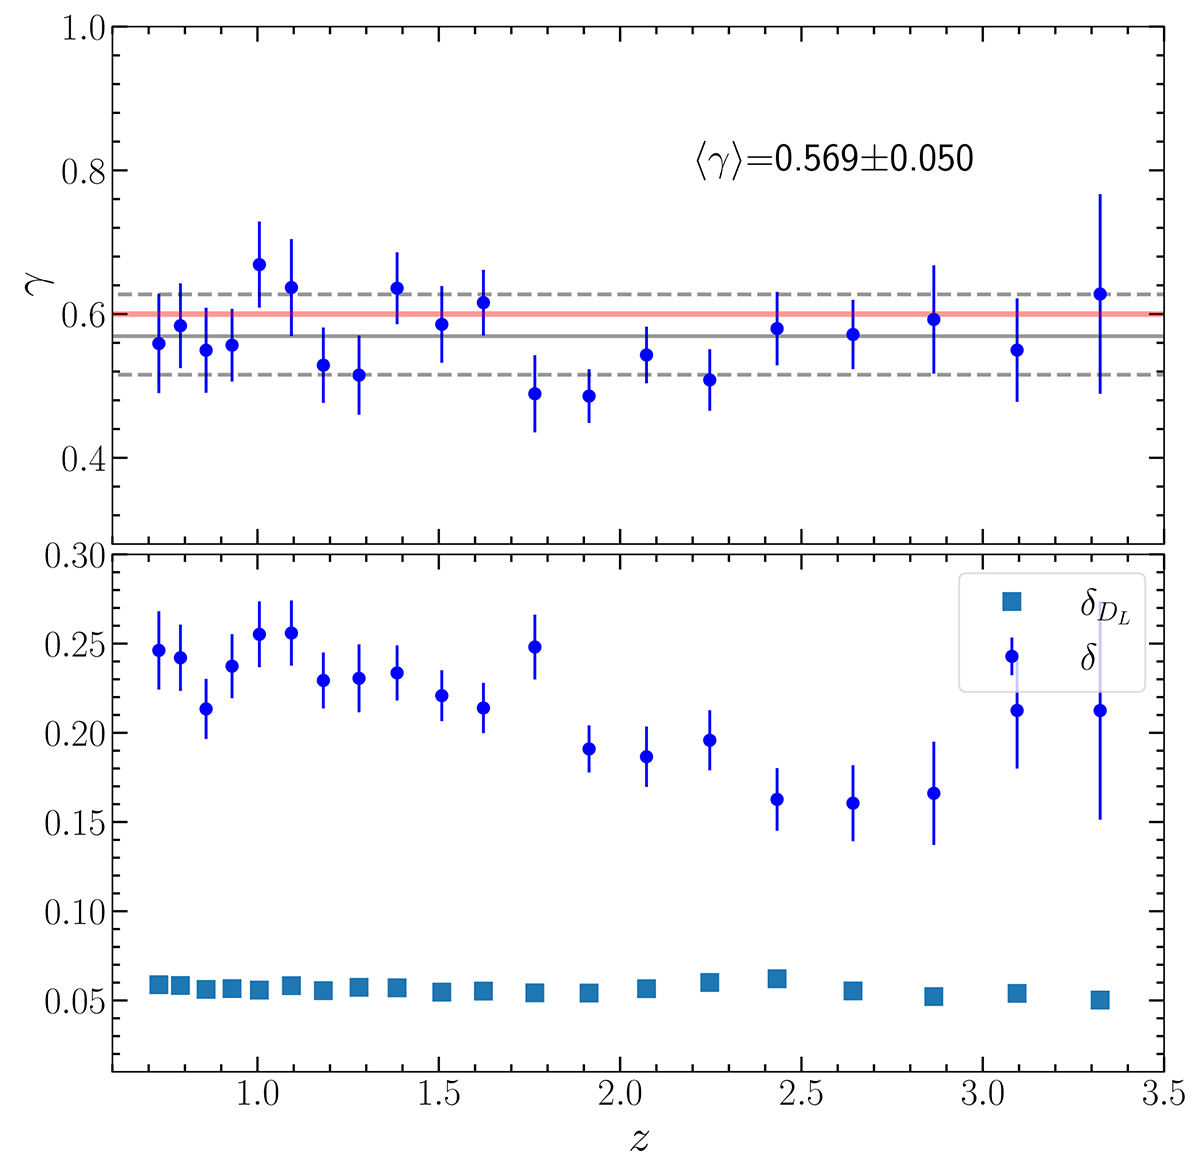
Redshift evolution of the slope of the FX − FUV relation in narrow redshift bins (top panel). To perform the regression fit, X-ray and UV fluxes are normalised to 10−31 and 10−27 erg s−1 cm−2 Hz−1, respectively. The data points are plotted at the average redshift within the interval. Error bars represent the 1σ uncertainty on the mean in each bin. The solid and dashed grey lines are the mean and 1σ uncertainty range on the slope (γ). The red line marks γ = 0.6. The bottom panel shows the dispersion (δ, blue filled circles) along the best fit of the FX − FUV relation and the dispersion of the distance distribution (δDL ≃ 0.06, square symbols) in each bin. See Section 5.3 for details.
Current usage metrics show cumulative count of Article Views (full-text article views including HTML views, PDF and ePub downloads, according to the available data) and Abstracts Views on Vision4Press platform.
Data correspond to usage on the plateform after 2015. The current usage metrics is available 48-96 hours after online publication and is updated daily on week days.
Initial download of the metrics may take a while.