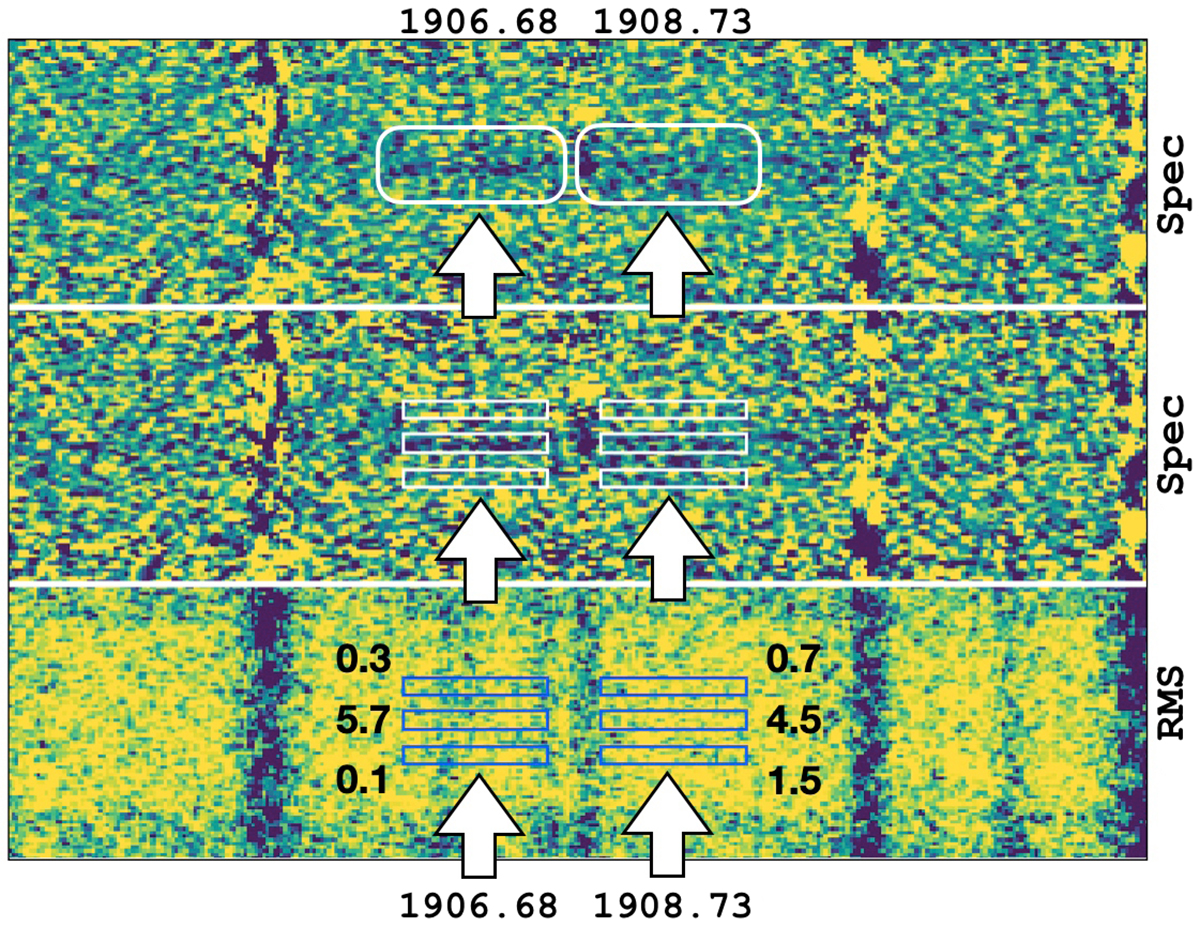
Fig. 11.
Download original image
Zoomed X-Shooter spectrum centerd on the CIII] doublet. Top: 2D spectrum at the original spectral resolution (R = 8900, 0.2 Å/pix) with the positions of the components indicated. Middle: Same spectrum as above with outlined the regions where the S/Ns were calculated in three spatial positions: below, above, and at the location of Ion3. The size of the boxes is 0.8″ × 250 km s−1. Bottom: 2D RMS spectrum is shown with reported the same boxes shown in the middle panel with listed the corresponding SN values. Detections emerge on top of Ion3 spatial position.
Current usage metrics show cumulative count of Article Views (full-text article views including HTML views, PDF and ePub downloads, according to the available data) and Abstracts Views on Vision4Press platform.
Data correspond to usage on the plateform after 2015. The current usage metrics is available 48-96 hours after online publication and is updated daily on week days.
Initial download of the metrics may take a while.