Fig. 2
Download original image
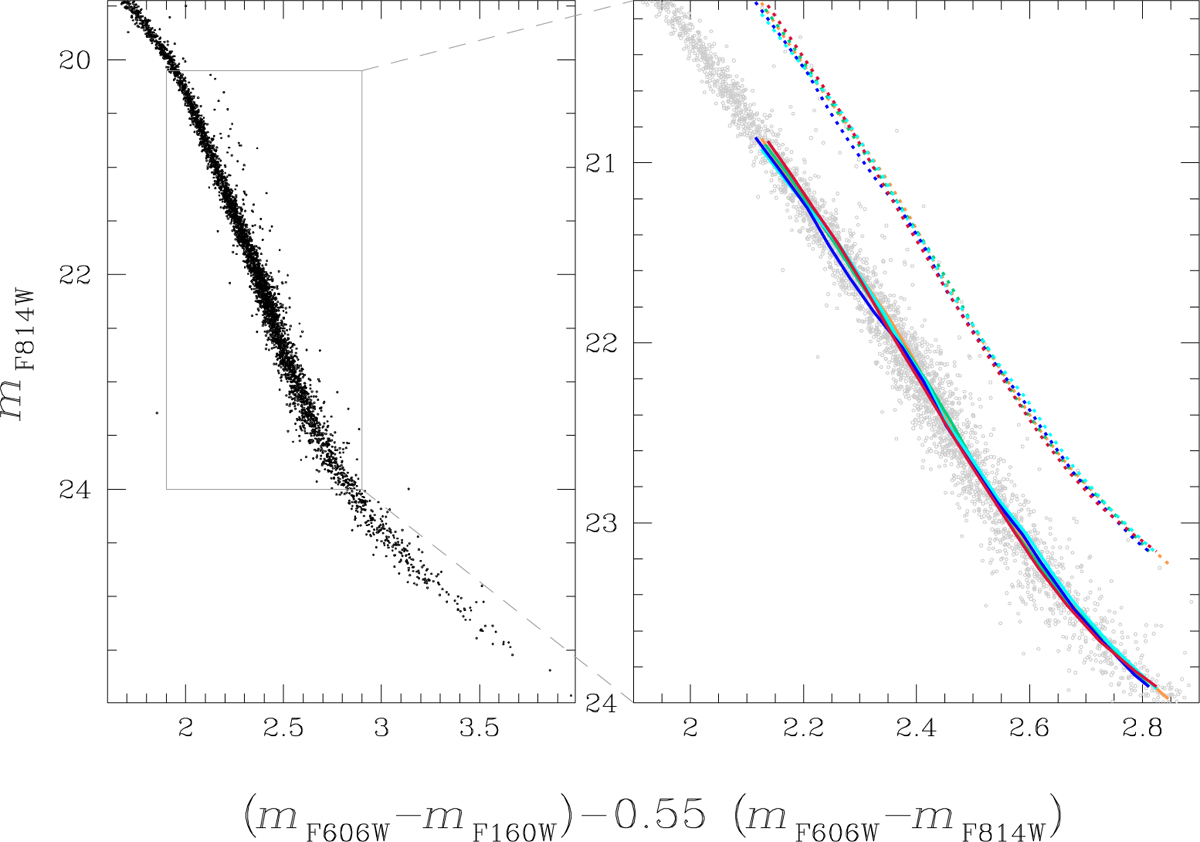
Left: mF814W as a function of the colour difference (mF606W – mF160W)-0.55(mF606W – mF814W) for the stars plotted in Fig. 1. Right: zoomed-in view of the pseudo-CMD plotted in the left panel around the MS region used to derive the ChM. The solid coloured lines, which partially overlap with each other, are the fiducial lines of the five populations identified in the ChM of Fig. 1. The fiducials of the corresponding sequences of equal-luminosity binaries are represented with dotted lines.
Current usage metrics show cumulative count of Article Views (full-text article views including HTML views, PDF and ePub downloads, according to the available data) and Abstracts Views on Vision4Press platform.
Data correspond to usage on the plateform after 2015. The current usage metrics is available 48-96 hours after online publication and is updated daily on week days.
Initial download of the metrics may take a while.