Open Access
Fig. 2.
Download original image
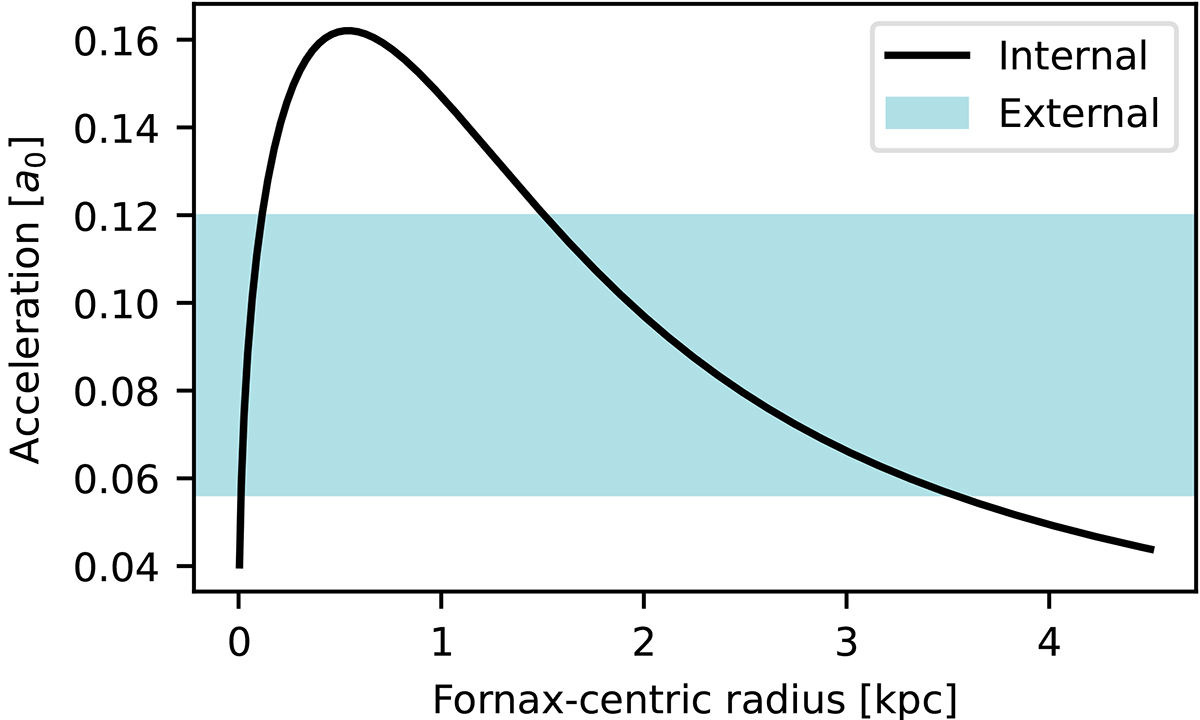
Internal and external gravitational accelerations in Fornax. The black curve indicates the profile of internal acceleration of Fornax calculated as if it were isolated. The horizontal band indicates the range of the external acceleration experienced by Fornax as it orbits the MW.
Current usage metrics show cumulative count of Article Views (full-text article views including HTML views, PDF and ePub downloads, according to the available data) and Abstracts Views on Vision4Press platform.
Data correspond to usage on the plateform after 2015. The current usage metrics is available 48-96 hours after online publication and is updated daily on week days.
Initial download of the metrics may take a while.