Fig. 5
Download original image
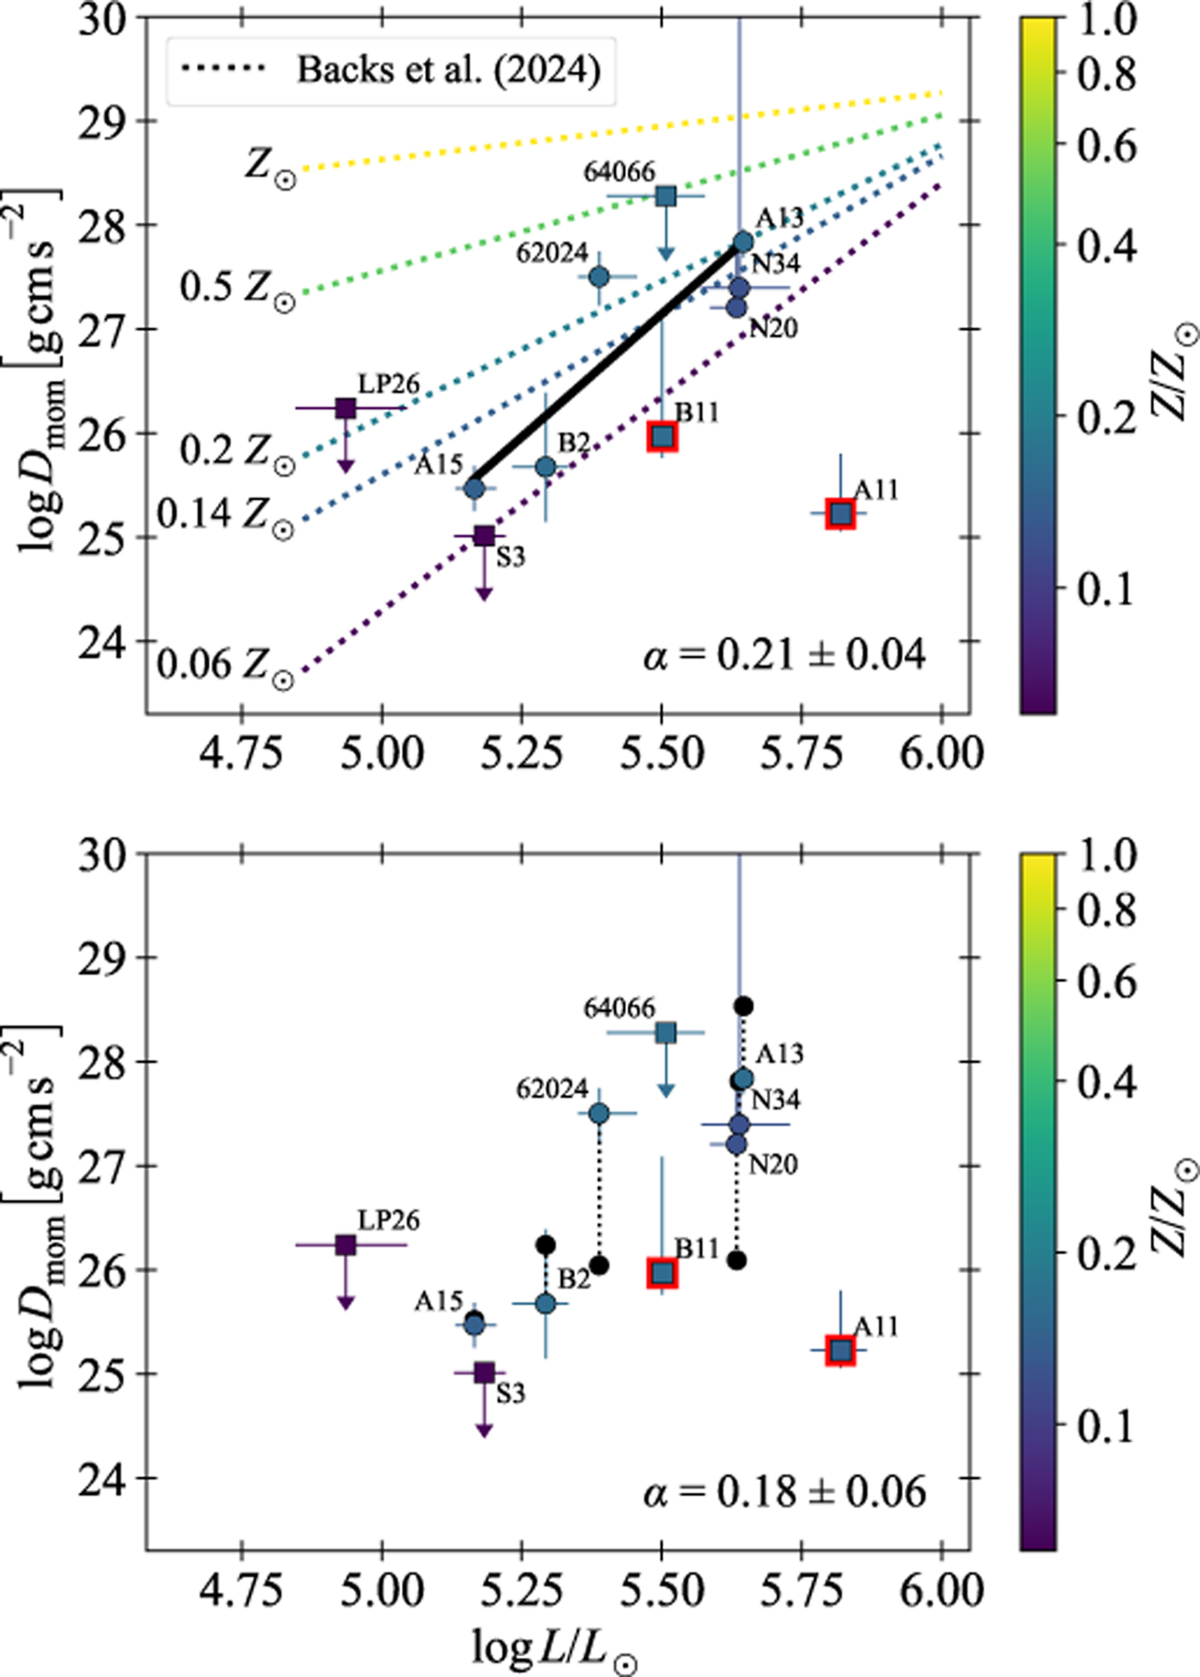
Top: fit of Eq. (7) based on the six points denoted with circles. Overplotted with dotted lines is the empirical relation of Dmom(L, Z) determined by Backs et al. (2024a). Bottom: projection of the two-dimensional fit to Dmom(L, Meff) (Eq. (8)) onto the luminosity axis, shown by black points (see text for further details). In both plots, the square points have been excluded from the fits, red borders indicate troublesome fits, the value for α determined from the fit is provided and the metallicity of both the tracks and the points are colour-coded. Uncertainty regions on the fit have been excluded for clarity. In the top panel they are large and span the entire vertical range of the panel.
Current usage metrics show cumulative count of Article Views (full-text article views including HTML views, PDF and ePub downloads, according to the available data) and Abstracts Views on Vision4Press platform.
Data correspond to usage on the plateform after 2015. The current usage metrics is available 48-96 hours after online publication and is updated daily on week days.
Initial download of the metrics may take a while.