Fig. 6
Download original image
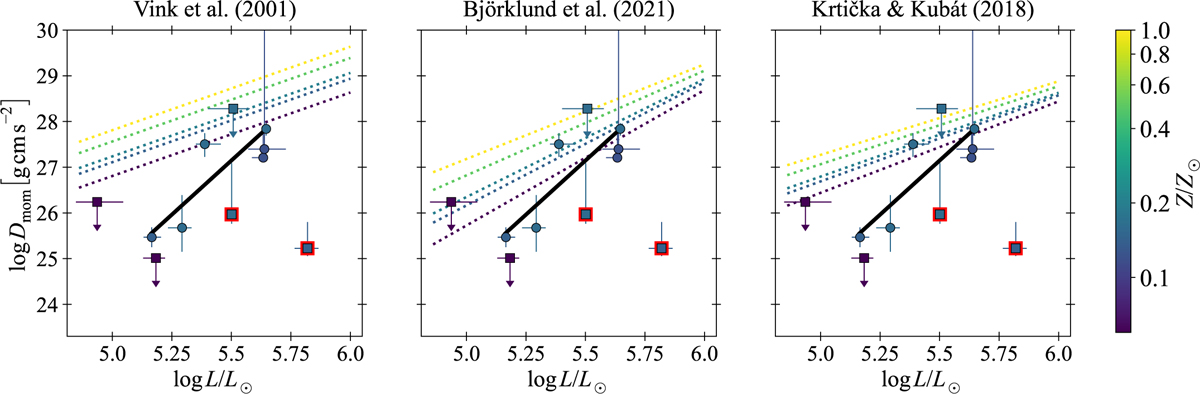
Fit of Dmom(L) obtained in this work compared to three different theoretical predictions (dotted coloured lines). In each plot, the points and the fit shown are the same as those shown in the top panel of Fig. 5, as are the Z values of each theoretical track. The colour coding of the predictions is the same as in Fig. 5. Uncertainties in the fit span the entire vertical range of the panel.
Current usage metrics show cumulative count of Article Views (full-text article views including HTML views, PDF and ePub downloads, according to the available data) and Abstracts Views on Vision4Press platform.
Data correspond to usage on the plateform after 2015. The current usage metrics is available 48-96 hours after online publication and is updated daily on week days.
Initial download of the metrics may take a while.