Open Access
Fig. 9
Download original image
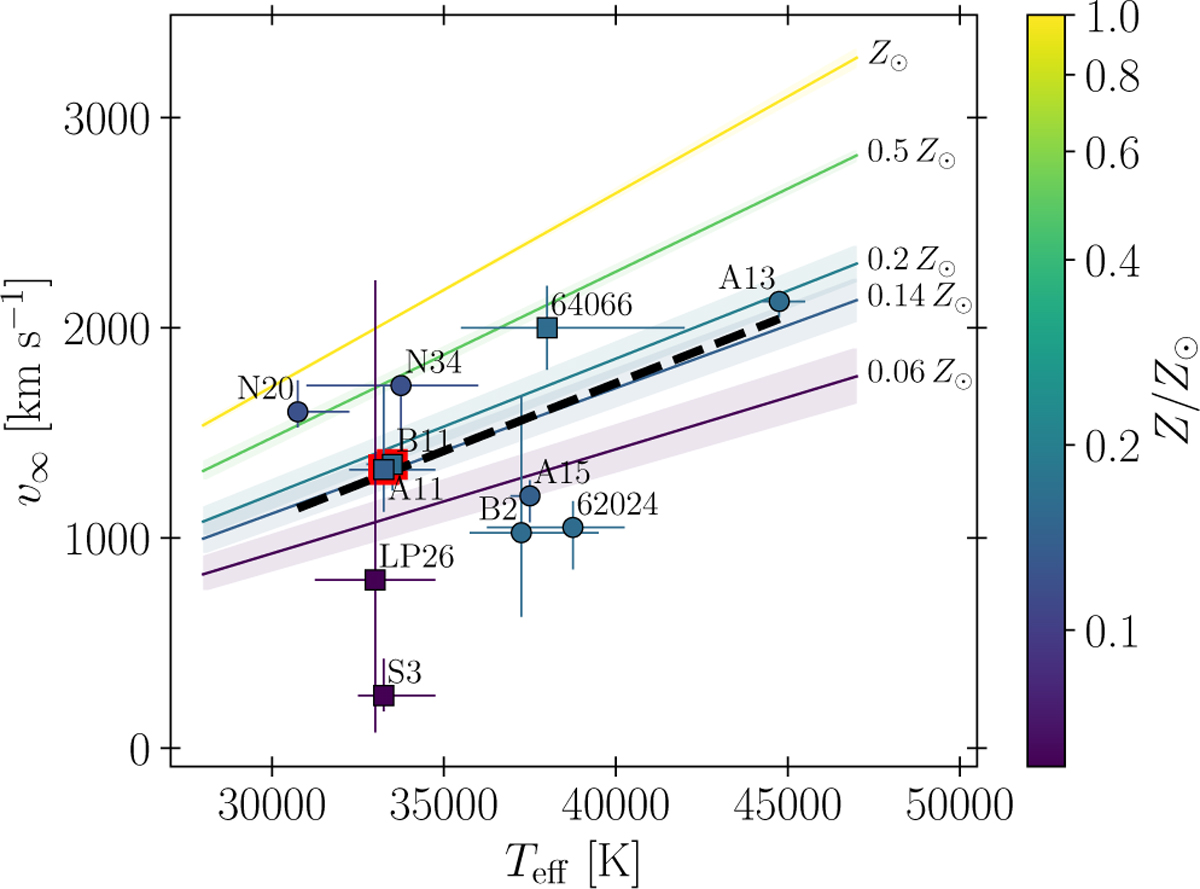
Terminal velocities overplotted on the empirical relation of Hawcroft et al. (2024b). The black dashed line represents an ODR fit through the circle points. As B2 and A15 have the same Teff, that of the former has been offset by −250 K for clarity. For similar reasons, that of B11 has been offset by +250 K.
Current usage metrics show cumulative count of Article Views (full-text article views including HTML views, PDF and ePub downloads, according to the available data) and Abstracts Views on Vision4Press platform.
Data correspond to usage on the plateform after 2015. The current usage metrics is available 48-96 hours after online publication and is updated daily on week days.
Initial download of the metrics may take a while.