Fig. 2.
Download original image
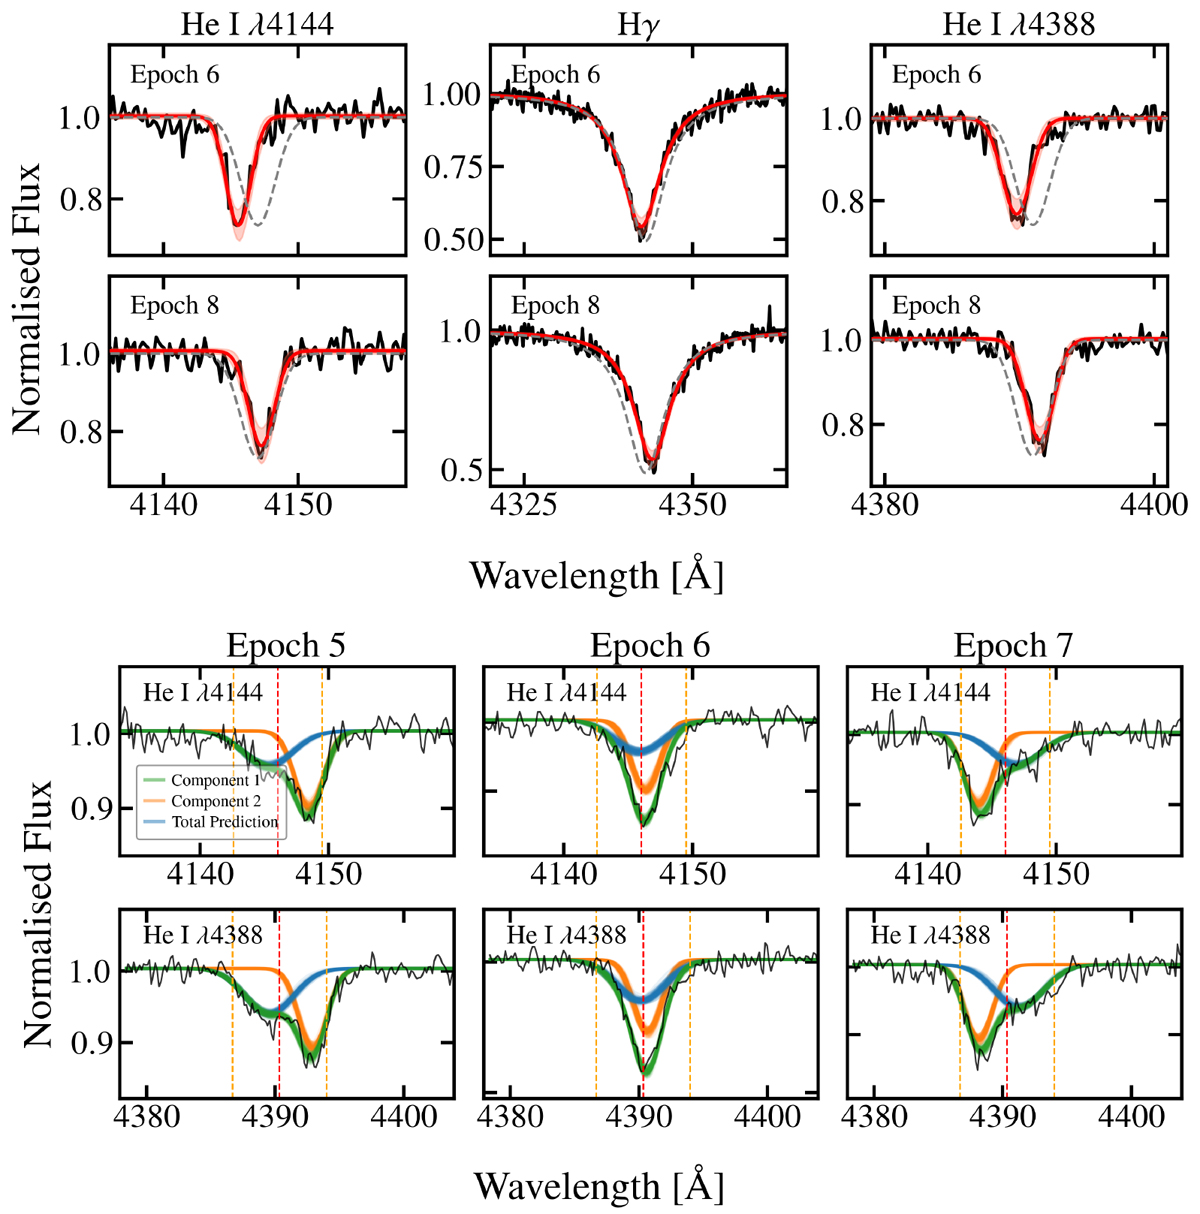
Top: spectral-line fits for the SB1 system BLOeM 4-097. Three different spectral lines are shown for epochs closest to quadrature. Observed spectrum (black) is overlaid by best fit and 1σ confidence levels (red); dashed grey profiles indicate initial guesses. Bottom: Similar to above, but for SB2 system BLOeM 1-055. Two He I lines at three epochs (near quadrature and conjunction) are shown. The dashed red line marks the mean SMC velocity of 172 km s−1 (Evans & Howarth 2008), with a ±200 km s−1 deviation (dashed yellow lines).
Current usage metrics show cumulative count of Article Views (full-text article views including HTML views, PDF and ePub downloads, according to the available data) and Abstracts Views on Vision4Press platform.
Data correspond to usage on the plateform after 2015. The current usage metrics is available 48-96 hours after online publication and is updated daily on week days.
Initial download of the metrics may take a while.