Open Access
Fig. 2.
Download original image
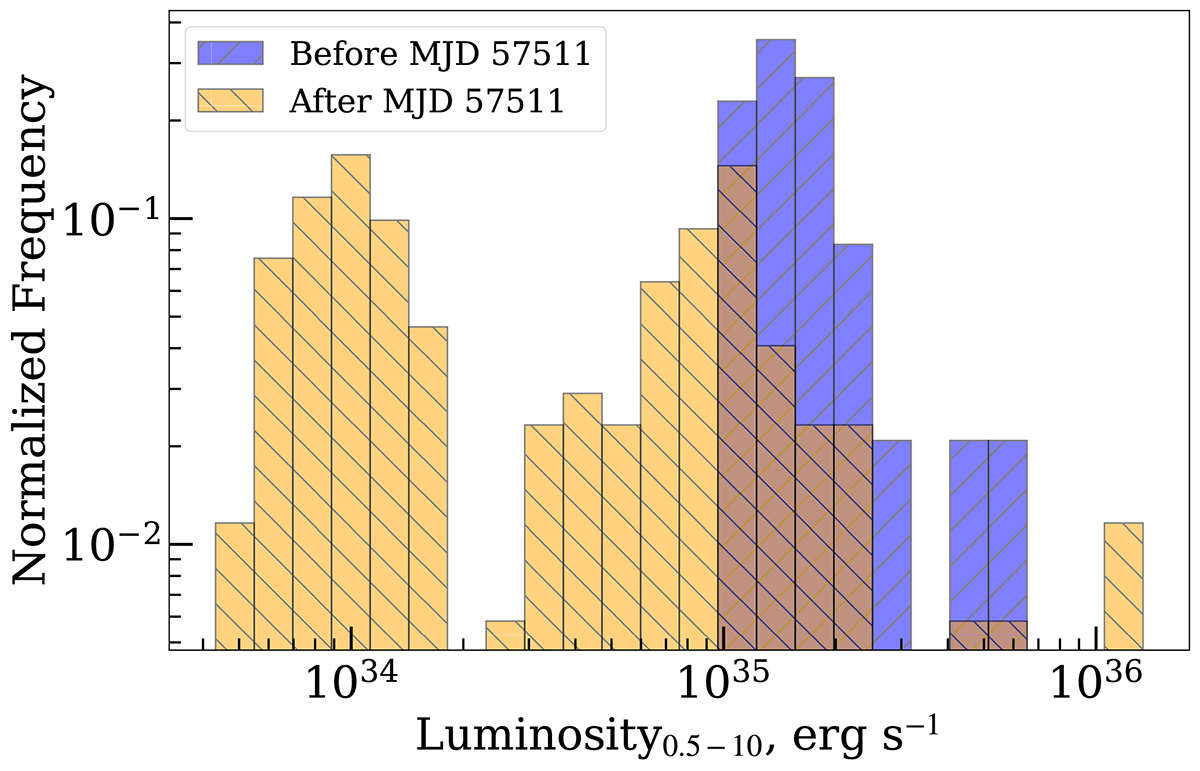
Histogram of the luminosity distribution before and after the transition to equilibrium for Swift/XRT, Chandra, and XMM-Newton observations. Fluxes were converted to luminosities assuming a distance of 5.4 kpc.
Current usage metrics show cumulative count of Article Views (full-text article views including HTML views, PDF and ePub downloads, according to the available data) and Abstracts Views on Vision4Press platform.
Data correspond to usage on the plateform after 2015. The current usage metrics is available 48-96 hours after online publication and is updated daily on week days.
Initial download of the metrics may take a while.