Fig. D.1
Download original image
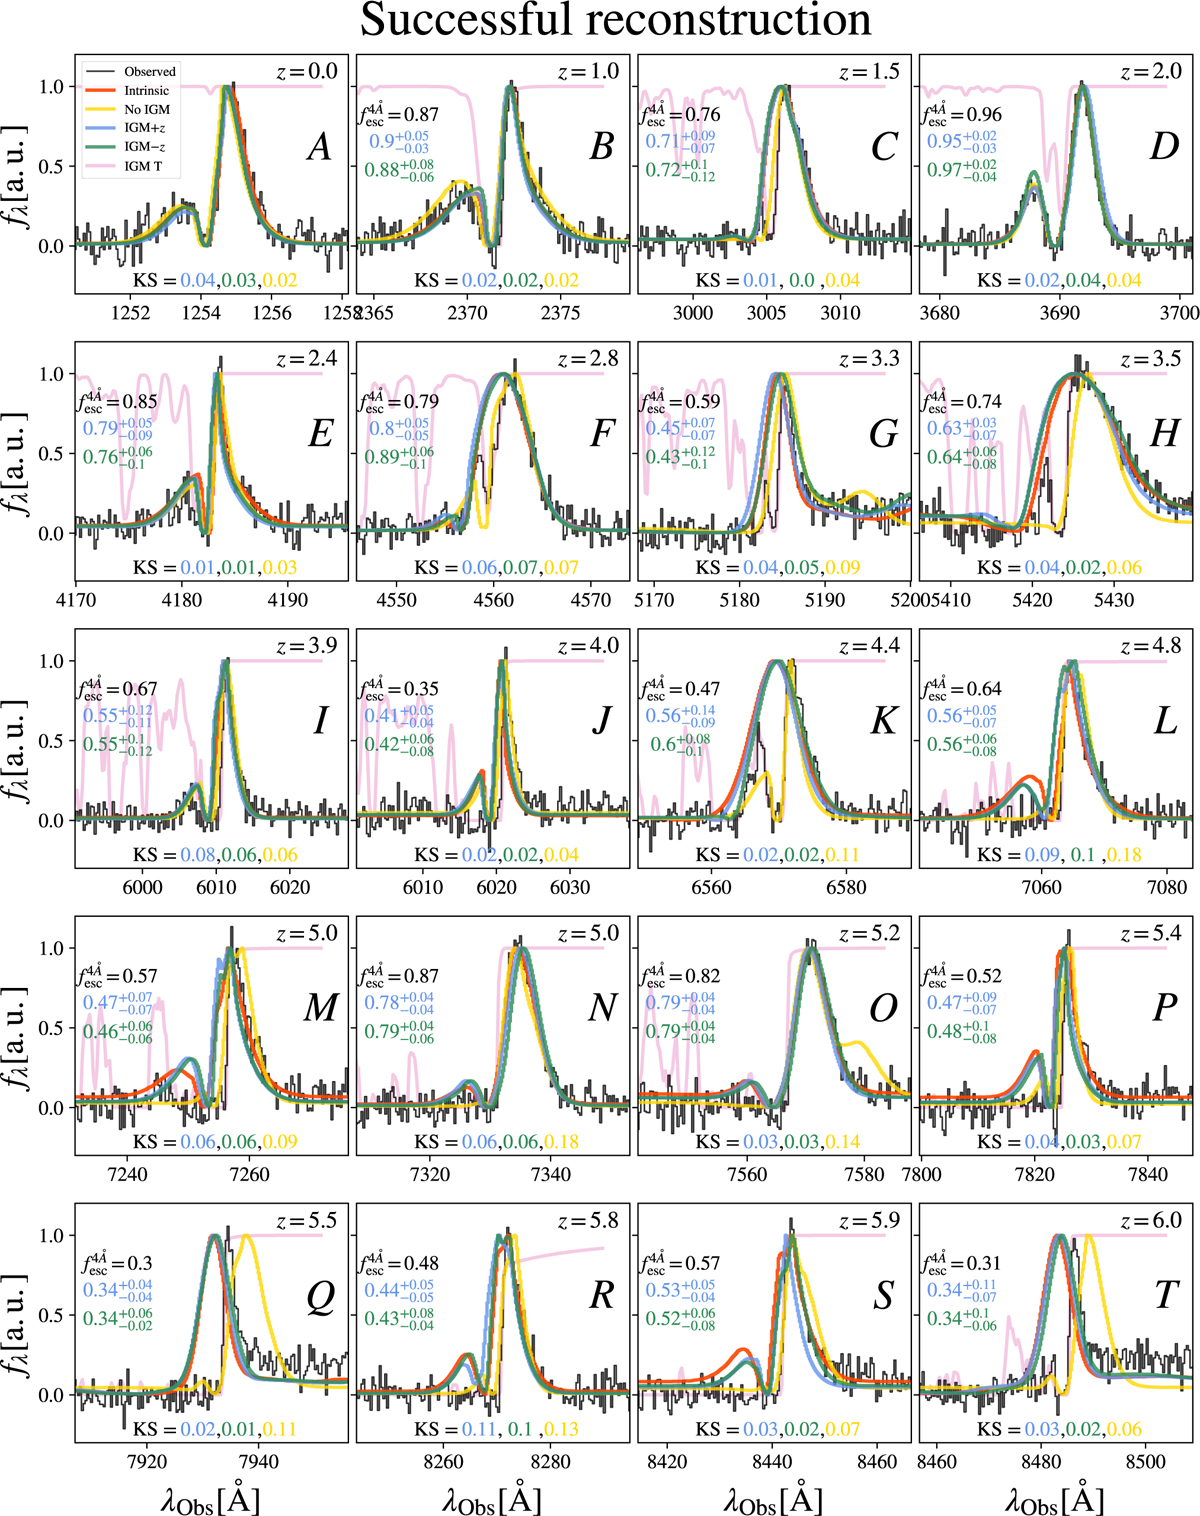
Examples of line profile successful reconstruction at different redshift. The redshift of the mock line profile is in the top right corner of each subpanel. The Lyα line after the ISM and before traveling through the IGM is shown in red. The IGM transmission curve is shown in pink. The observed line profile, after IGM absorption and mocking observation conditions, is shown in black. S/Np = 15.0 is fixed for all the line profiles. Meanwhile, Wg is 0.1(1+z) so that the resolution element is constant in rest frame. zELDA’s prediction for the models IGM+z, IGM-z and NoIGM are displayed in blue, green and yellow, respectively. In each panel the true ![]() is displayed in black while zELDA’s predictions are shown in color text matching the model used with their uncertainties below it. In the bottom of each panel the KS between the true Lyα line profile before the IGM absorption and zELDA prediction is displayed in different colors matching the model used.
is displayed in black while zELDA’s predictions are shown in color text matching the model used with their uncertainties below it. In the bottom of each panel the KS between the true Lyα line profile before the IGM absorption and zELDA prediction is displayed in different colors matching the model used.
Current usage metrics show cumulative count of Article Views (full-text article views including HTML views, PDF and ePub downloads, according to the available data) and Abstracts Views on Vision4Press platform.
Data correspond to usage on the plateform after 2015. The current usage metrics is available 48-96 hours after online publication and is updated daily on week days.
Initial download of the metrics may take a while.