Fig. E.1
Download original image
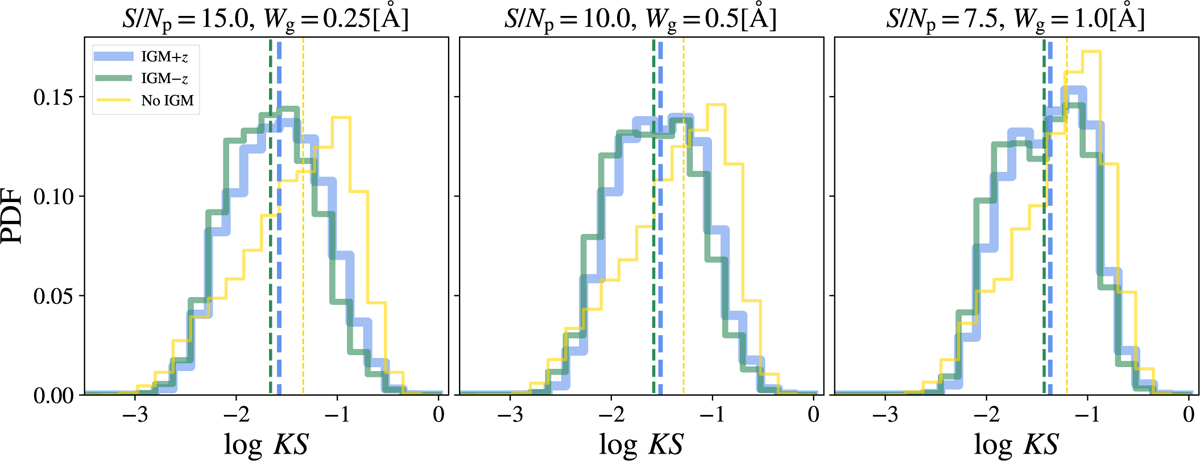
Kolmogórov-Smirnov estimator distribution comparison between models. zELDA’s prediction using the IGM+z, IGM-z and NoIGM models are displayed in blue, green and yellow, respectively. Each subpanel show the KS distribution at different observed line profile qualities. In particular, in the left panel S/Np = 15.0 and Wg = 0.25 Å, in the middle panel S/Np = 10.0 and Wg = 0.5 Å, in the right panel S/Np = 7.0 and Wg = 1.0 Å. The vertical dashed lines mark the median of the KS distribution of the matching color.
Current usage metrics show cumulative count of Article Views (full-text article views including HTML views, PDF and ePub downloads, according to the available data) and Abstracts Views on Vision4Press platform.
Data correspond to usage on the plateform after 2015. The current usage metrics is available 48-96 hours after online publication and is updated daily on week days.
Initial download of the metrics may take a while.