Fig. 3
Download original image
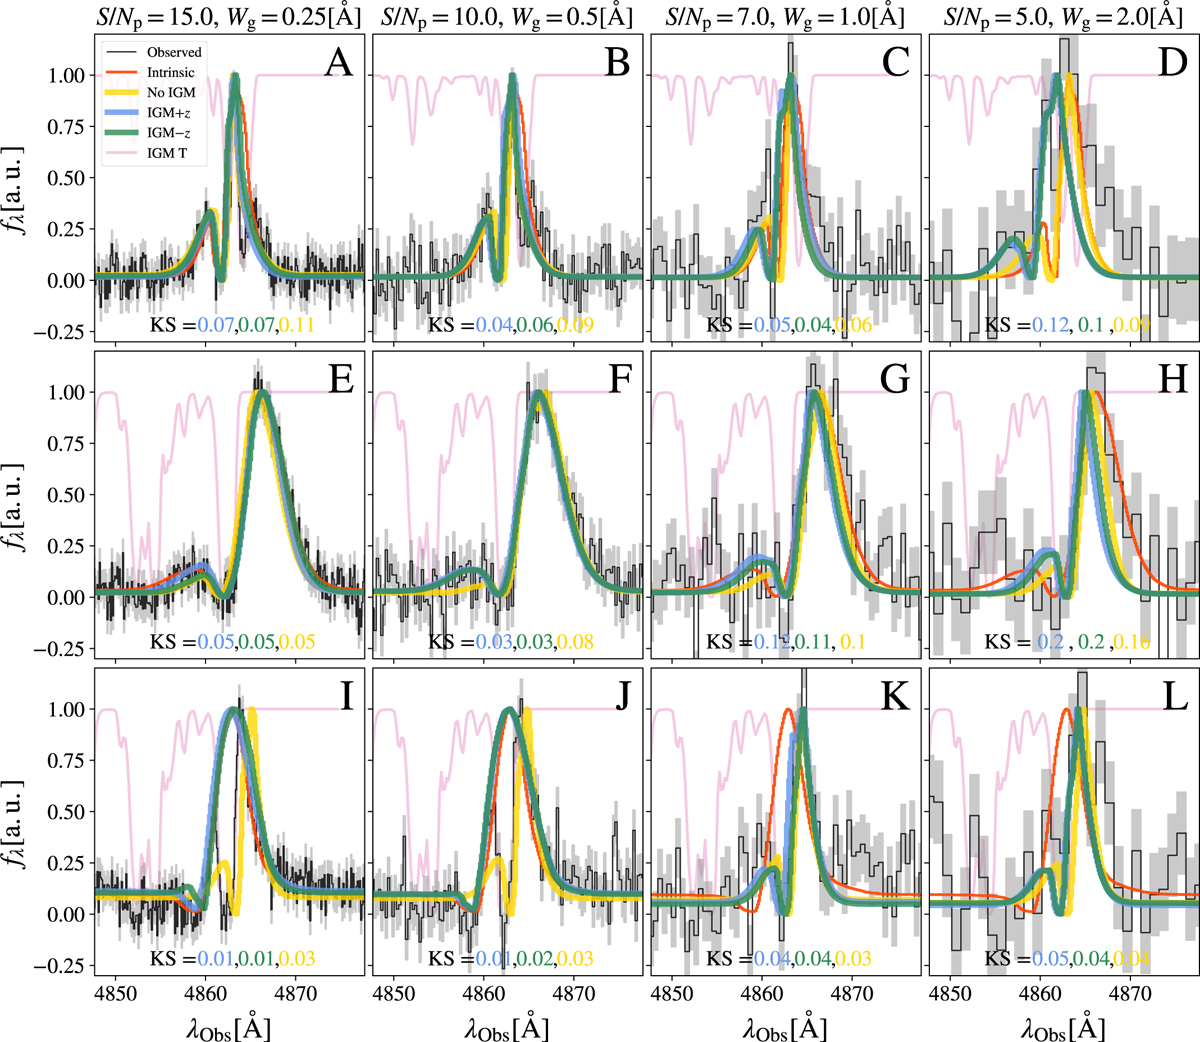
Example of line-profile reconstruction at different line-profile qualities and using our different models. The true Lyα line before passing through the IGM is displayed in red. The IGM transmission curve is shown in pink. The true Lyα line profile is fixed in each row. The observed line profile, after IGM absorption and mocking observation conditions, is shown in black. The observation conditions are fixed in each column as Wg = 0.25 Å, S/Np = 15.0, Wg = 0.5 Å, S/Np = 10.0, Wg = 1.0 Å, S/Np = 7.0, and Wg = 2.0 Å, S/Np = 5.0 from left to right, respectively. The zELDA prediction for the models IGM+z, IGM-z, and NoIGM are displayed in blue, green, and yellow, respectively. In the bottom of each panel the KS estimation between the true Lyα line profile before the IGM absorption and zELDA prediction is displayed in colours matching the model used.
Current usage metrics show cumulative count of Article Views (full-text article views including HTML views, PDF and ePub downloads, according to the available data) and Abstracts Views on Vision4Press platform.
Data correspond to usage on the plateform after 2015. The current usage metrics is available 48-96 hours after online publication and is updated daily on week days.
Initial download of the metrics may take a while.