Fig. 4
Download original image
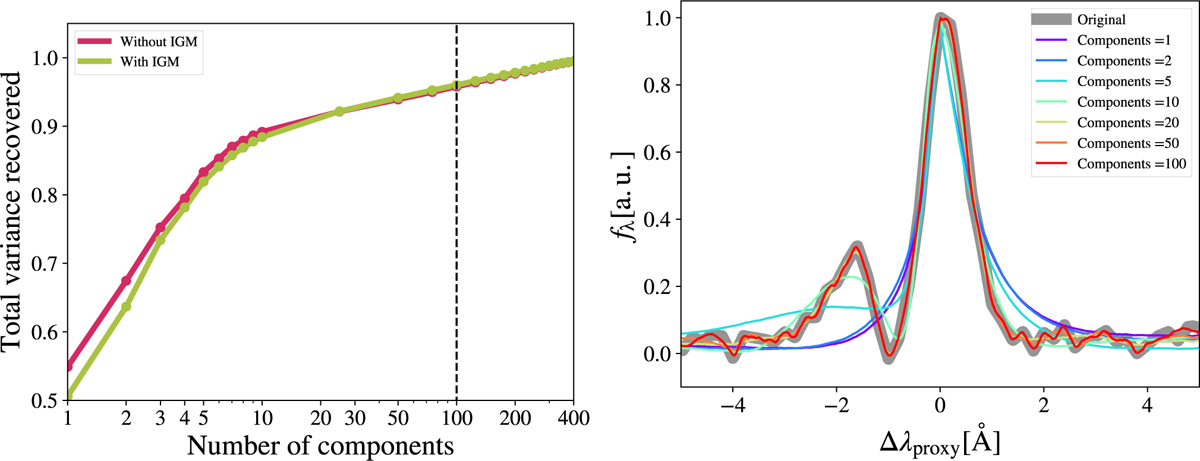
Left: total variance recovered as function of number of principle components. We show Lyα line profiles spamming zELDA’s grid without (with) IGM absorption in red (green). The dashed black line marks the number of principal components used for the input of the artificial neural networks. We fixed the number of PCA to 100 to achieve a re-coverage of 95% of the total variance. Right: example of PCA decomposition in an IGM clean-shell model line profile. The line profiles are shown in the proxy rest frame. The original mock line profile is shown in grey. Meanwhile, the reconstructed line profiles using the N first principal components are displayed in the legend.
Current usage metrics show cumulative count of Article Views (full-text article views including HTML views, PDF and ePub downloads, according to the available data) and Abstracts Views on Vision4Press platform.
Data correspond to usage on the plateform after 2015. The current usage metrics is available 48-96 hours after online publication and is updated daily on week days.
Initial download of the metrics may take a while.