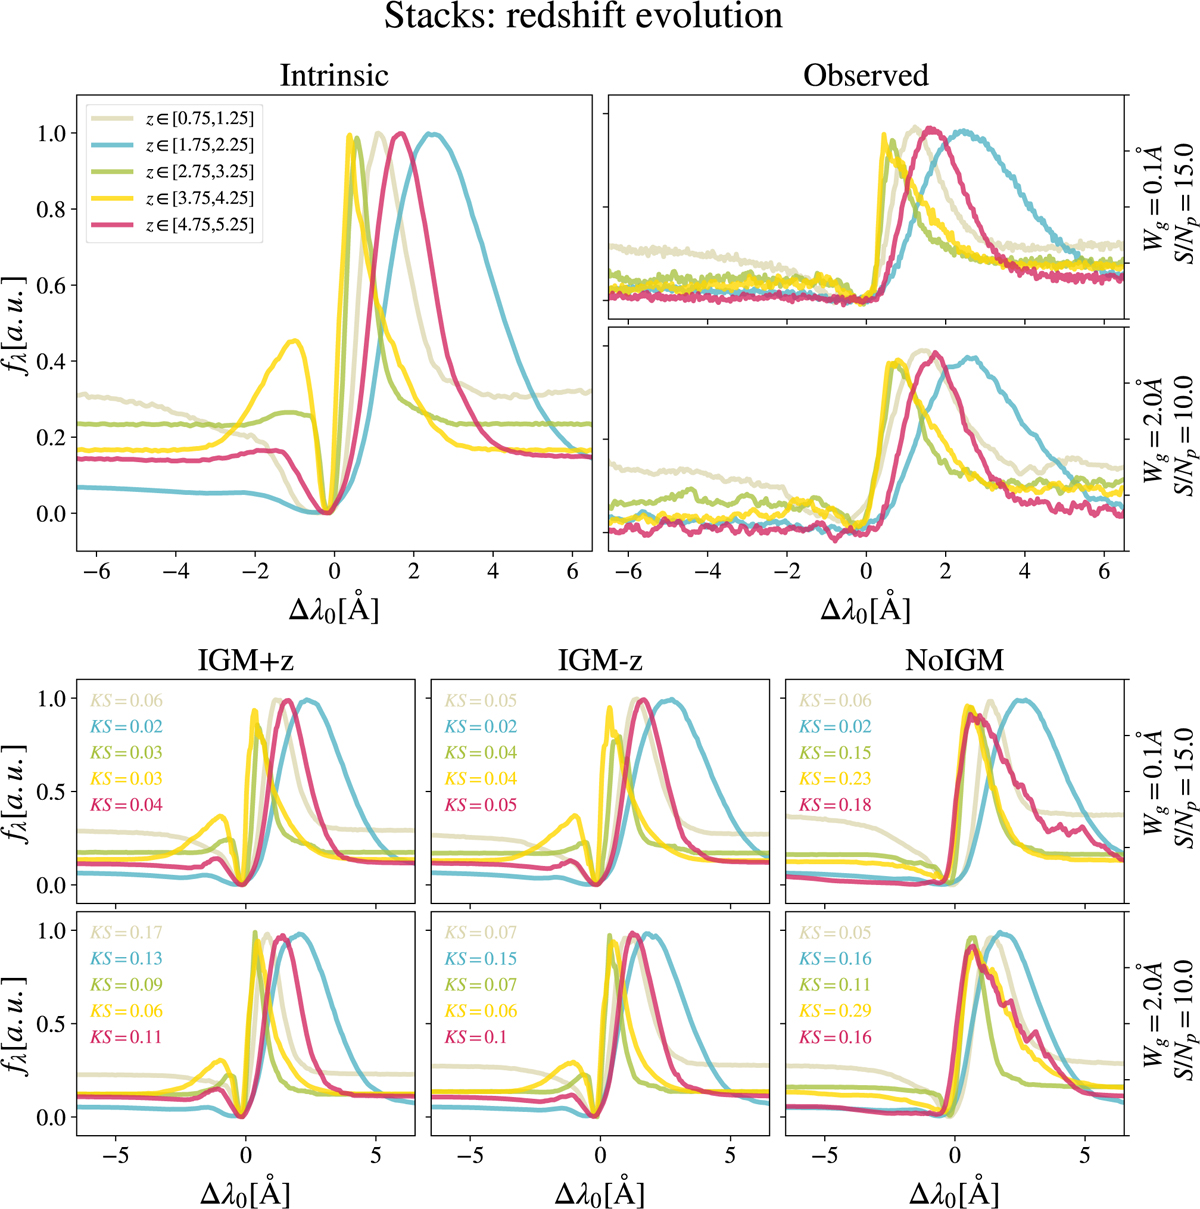
Fig. 8
Download original image
Stacked line-profile reconstruction example in mock Lyα line profiles using the Lyα line profiles with redshift dependence. The stacked line profile is shown the redshift intervals [0.75,1.25] (grey), [1.75,2.25] (blue), [2.75,3.25] (green), [3.75,4.25] (yellow), and [4.75,5.25] (red). The Lyα stacked line profiles using the Lyα line profiles before applying the IGM absorption are displayed in the top left panel. The two top right panels display the Lyα stacked line profile after applying the IGM absorption and mocking observation qualities similar to those of HST (Wg=0.1 Å and S/Np = 15.0, top) and MUSE (Wg = 2.0 Å and S/Np = 10.0, bottom). The six bottom panels show the reconstructed stacked Lyα line profiles. Each bottom column makes use of a different ANN model: IGM+z, IGM-z, and NoIGM from left to right. The KS between the stacked Lyα line profile before the IGM (left column) and that of the reconstructed Lyα line profiles is displayed in coloured text matching the redshift bin.
Current usage metrics show cumulative count of Article Views (full-text article views including HTML views, PDF and ePub downloads, according to the available data) and Abstracts Views on Vision4Press platform.
Data correspond to usage on the plateform after 2015. The current usage metrics is available 48-96 hours after online publication and is updated daily on week days.
Initial download of the metrics may take a while.