Fig. A.1
Download original image
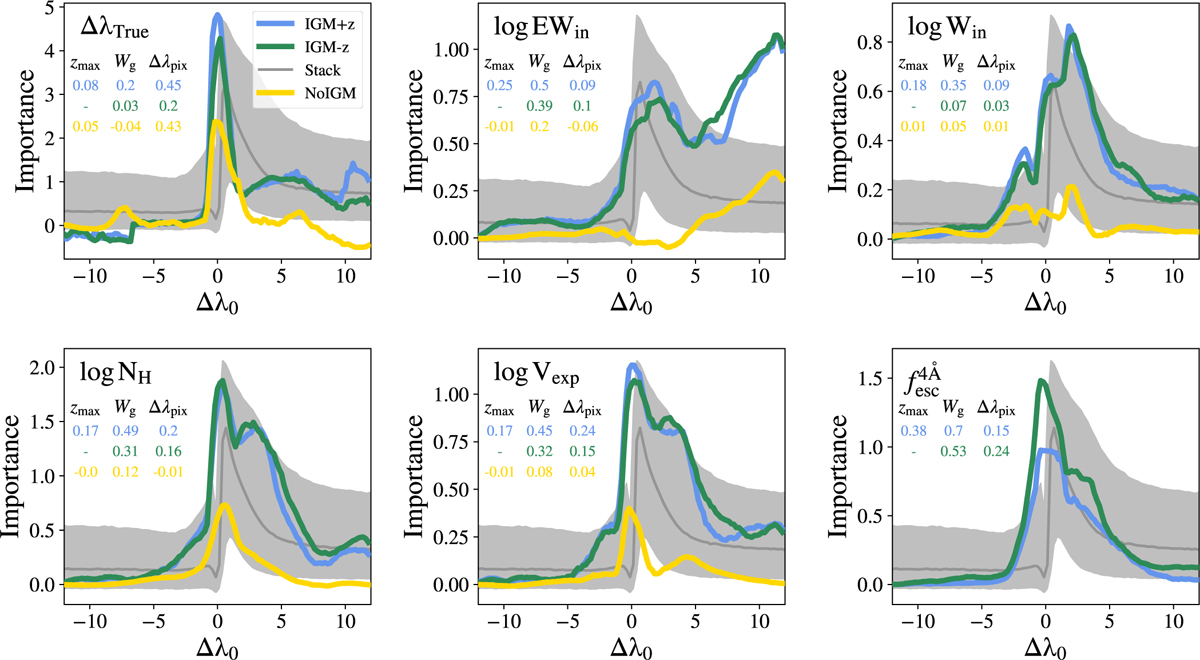
Feature importance analysis for the IGM+z (blue), IGM-z (green) and NoIGM (yellow). For comparison, the stacked line profiles with its 1σ scatter is shown in grey. Each subplot shows the importance determining a different property. In top row, ΔλTrue, EWin, Win from left to right. In the bottom row, NH, Vexp, ![]() from left to right. In each subplot we also show the zmax, Wg and ΔλPix importance for each model in its matching color in the small table.
from left to right. In each subplot we also show the zmax, Wg and ΔλPix importance for each model in its matching color in the small table.
Current usage metrics show cumulative count of Article Views (full-text article views including HTML views, PDF and ePub downloads, according to the available data) and Abstracts Views on Vision4Press platform.
Data correspond to usage on the plateform after 2015. The current usage metrics is available 48-96 hours after online publication and is updated daily on week days.
Initial download of the metrics may take a while.