Fig. 1
Download original image
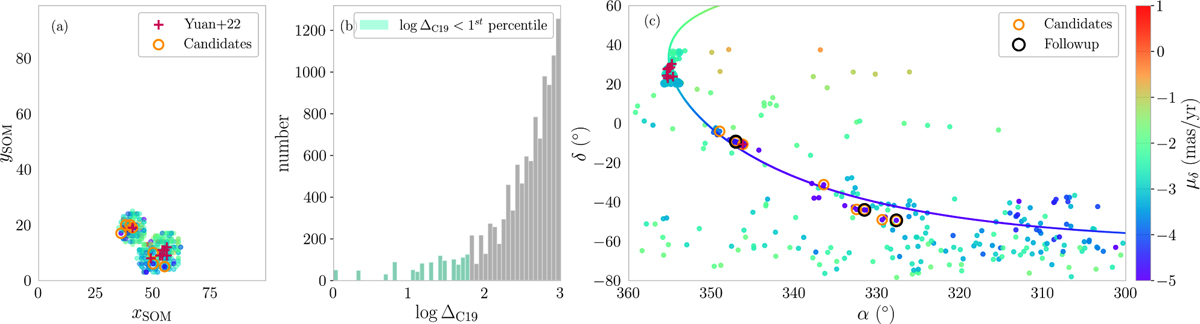
(a) Self-organizing map trained by the STREAMFINDER catalog in the space of (E, Lz, θ, ϕ). The gray color bar represents the differences in the weight vectors between neighboring neurons. Previously confirmed C-19 members are projected onto the SOM and plotted as red crosses. (b) Histogram of the logarithmic distances in the weight vector space between the existing C-19 stars and stars from the STREAMFINDER catalog (ΔC19). Stars below the first percentile are selected as candidate C-19 members and shown in green in the histogram. They are also plotted as small colored circles in the other panels, with the color representing their proper motions in Gaia DR3 along the declination direction, μδ. Candidates brighter than G = 17.5 are further highlighted by yellow circles. (c) On-sky projection of the candidate members, color coded by μδ. Two stream segments are identifiable with similar μδ. The final four candidates for follow-up, selected through other means (see text) are highlighted with black circles.
Current usage metrics show cumulative count of Article Views (full-text article views including HTML views, PDF and ePub downloads, according to the available data) and Abstracts Views on Vision4Press platform.
Data correspond to usage on the plateform after 2015. The current usage metrics is available 48-96 hours after online publication and is updated daily on week days.
Initial download of the metrics may take a while.