Open Access
Fig. 6.
Download original image
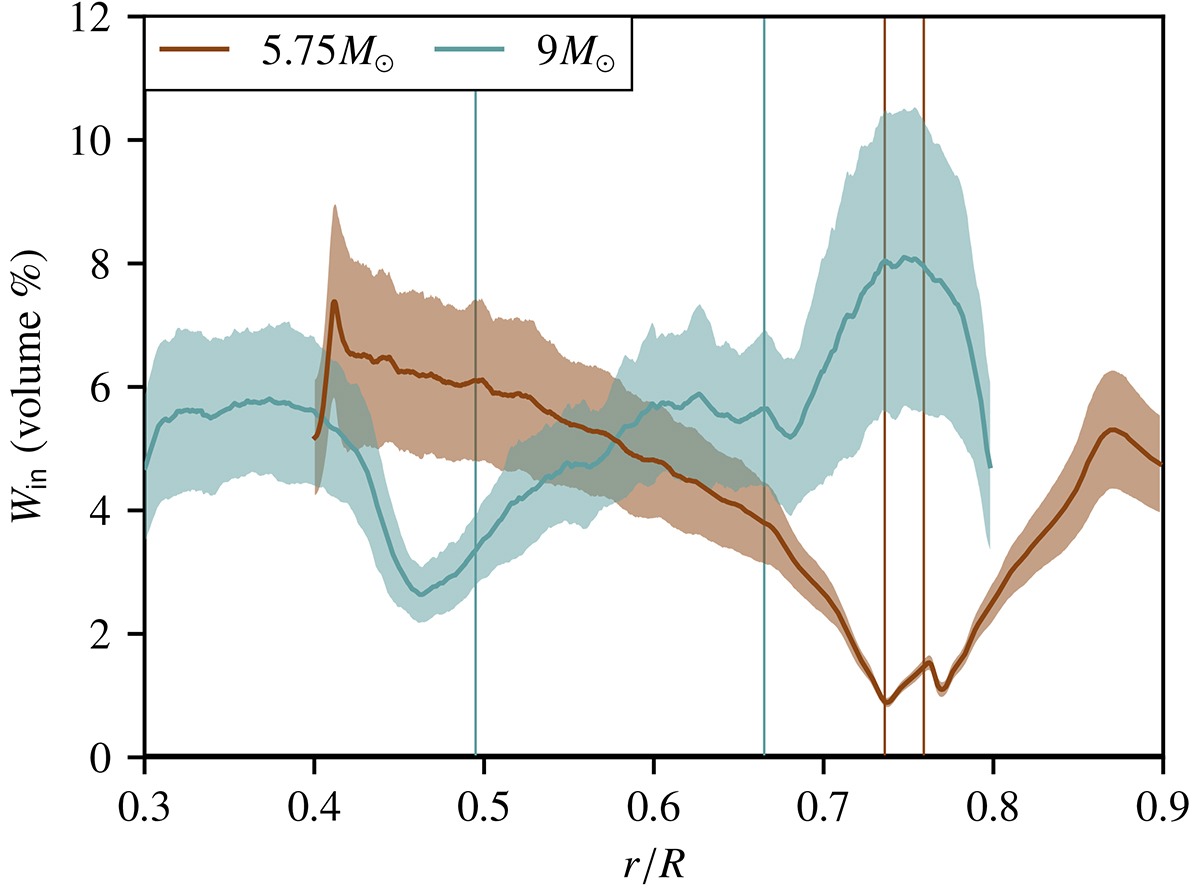
Width of inflowing plumes Win for the 5.75 and the 9 M⊙ simulations as a function of the star’s radius. Shaded areas indicate one standard deviation above and below the time-averaged line. Thin vertical lines indicate the radial position of the Schwarzschild boundaries.
Current usage metrics show cumulative count of Article Views (full-text article views including HTML views, PDF and ePub downloads, according to the available data) and Abstracts Views on Vision4Press platform.
Data correspond to usage on the plateform after 2015. The current usage metrics is available 48-96 hours after online publication and is updated daily on week days.
Initial download of the metrics may take a while.