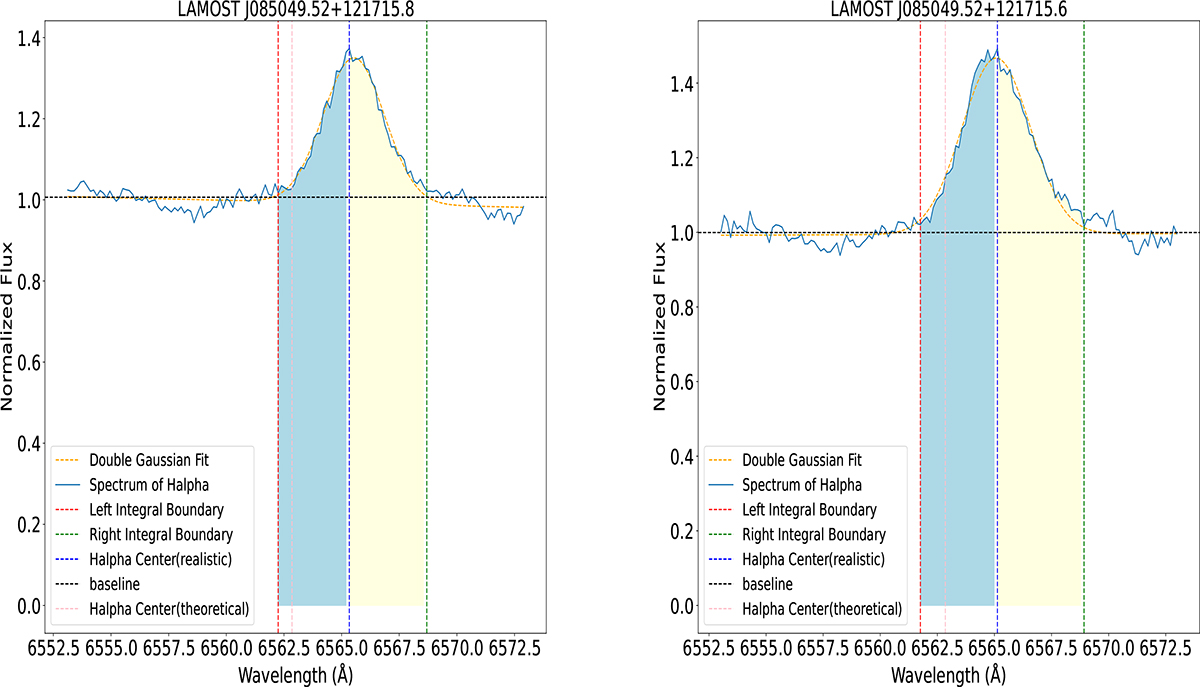
Fig. 16.
Download original image
Two examples of Hα profile asymmetries. Left panel: LAMOST J085049.52+121715.8. Right panel: LAMOST J085049.52+121715.6. The dashed red and green lines represent the integration boundaries, the dashed pink and blue lines mark the theoretical and actual peak positions of the Hα profile, and the bright blue and yellow lines highlight the integration areas. The dashed yellow line shows the result of a double Gaussian fit for reference.
Current usage metrics show cumulative count of Article Views (full-text article views including HTML views, PDF and ePub downloads, according to the available data) and Abstracts Views on Vision4Press platform.
Data correspond to usage on the plateform after 2015. The current usage metrics is available 48-96 hours after online publication and is updated daily on week days.
Initial download of the metrics may take a while.