Fig. 10.
Download original image
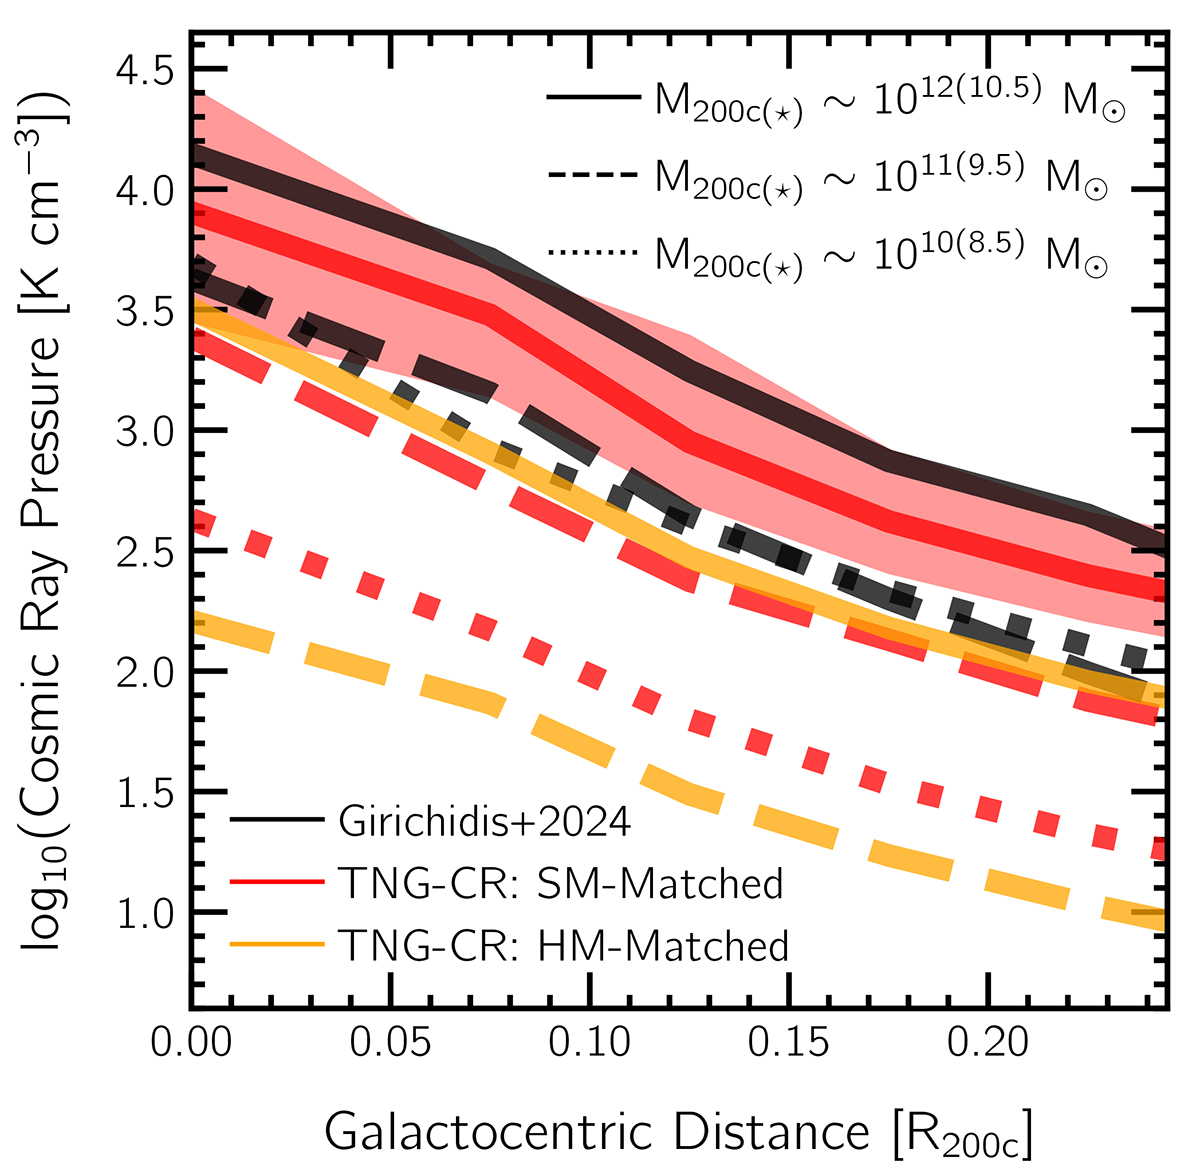
Comparison of spherically averaged radial profiles of the CR pressure (Pcr = ecr/3) between TNG-CR and an advanced spectral CR scheme (Girichidis et al. 2024). Solid, dashed and dotted curves correspond to M200c ∼ 1012, 1011 and 1010 M⊙ halos, respectively. In the Girichidis et al. (2024) simulations, the galaxies at the center of these halos have stellar masses M⋆ ∼ 1010.5, 109.5 and 108.5 M⊙, shown through the different black curves. Red curves correspond to TNG-CR profiles of galaxies matched with respect to stellar mass, while profiles of the halo-matched TNG-CR sample is shown in orange. Only for the solid red curve, we additionally plot the 16th–84th variation across the sample. The stellar mass matched sample, except for the least massive bin, roughly matches the black curves (within a factor of ∼1.5). The halo mass matched sample however is offset by much larger factors, owing to suppressed stellar masses at fixed halo mass.
Current usage metrics show cumulative count of Article Views (full-text article views including HTML views, PDF and ePub downloads, according to the available data) and Abstracts Views on Vision4Press platform.
Data correspond to usage on the plateform after 2015. The current usage metrics is available 48-96 hours after online publication and is updated daily on week days.
Initial download of the metrics may take a while.