Fig. 2.
Download original image
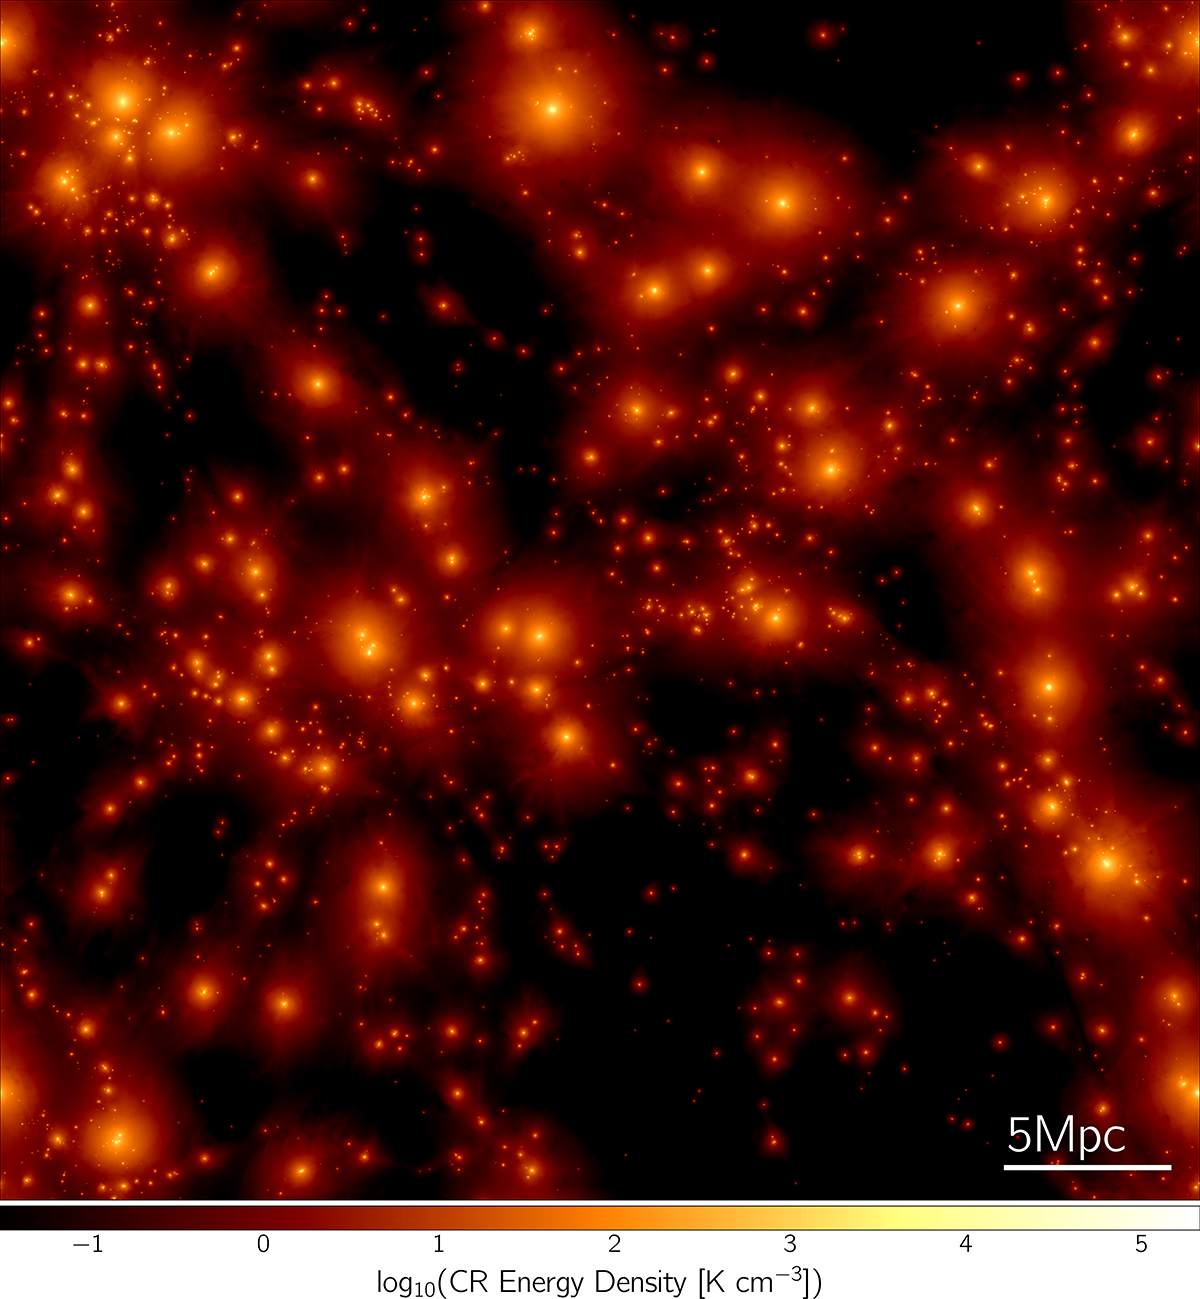
Visualization of the projected CR energy density through the simulated volume (at z = 0) of the realization with (vst, eff, κeff) = (100 km s−1 , 5 × 1028 cm2 s−1), i.e., the fiducial set of parameters we use. The image extends 25 h−1 ∼ 37 Mpc along the x- and y-axes of the plane, as well as in the projection direction. CR energy densities are as high as ≳105 K cm−3 at the centers of galaxies, i.e., at the sites of star formation, and decay with increasing distance. Halos with multiple such sources, i.e., contributions from satellite galaxies in addition to the central, have multiple bright dots, leading to a certain degree of asymmetry in the CR energy density profile; the halo toward the lower left corner of the image is a representative example. The corresponding nonthermal CR pressure, as well as secondary effects due to associated heating plus ionization terms, has a noticeable impact on the evolution of galaxies, as we shall explore throughout the rest of this work.
Current usage metrics show cumulative count of Article Views (full-text article views including HTML views, PDF and ePub downloads, according to the available data) and Abstracts Views on Vision4Press platform.
Data correspond to usage on the plateform after 2015. The current usage metrics is available 48-96 hours after online publication and is updated daily on week days.
Initial download of the metrics may take a while.