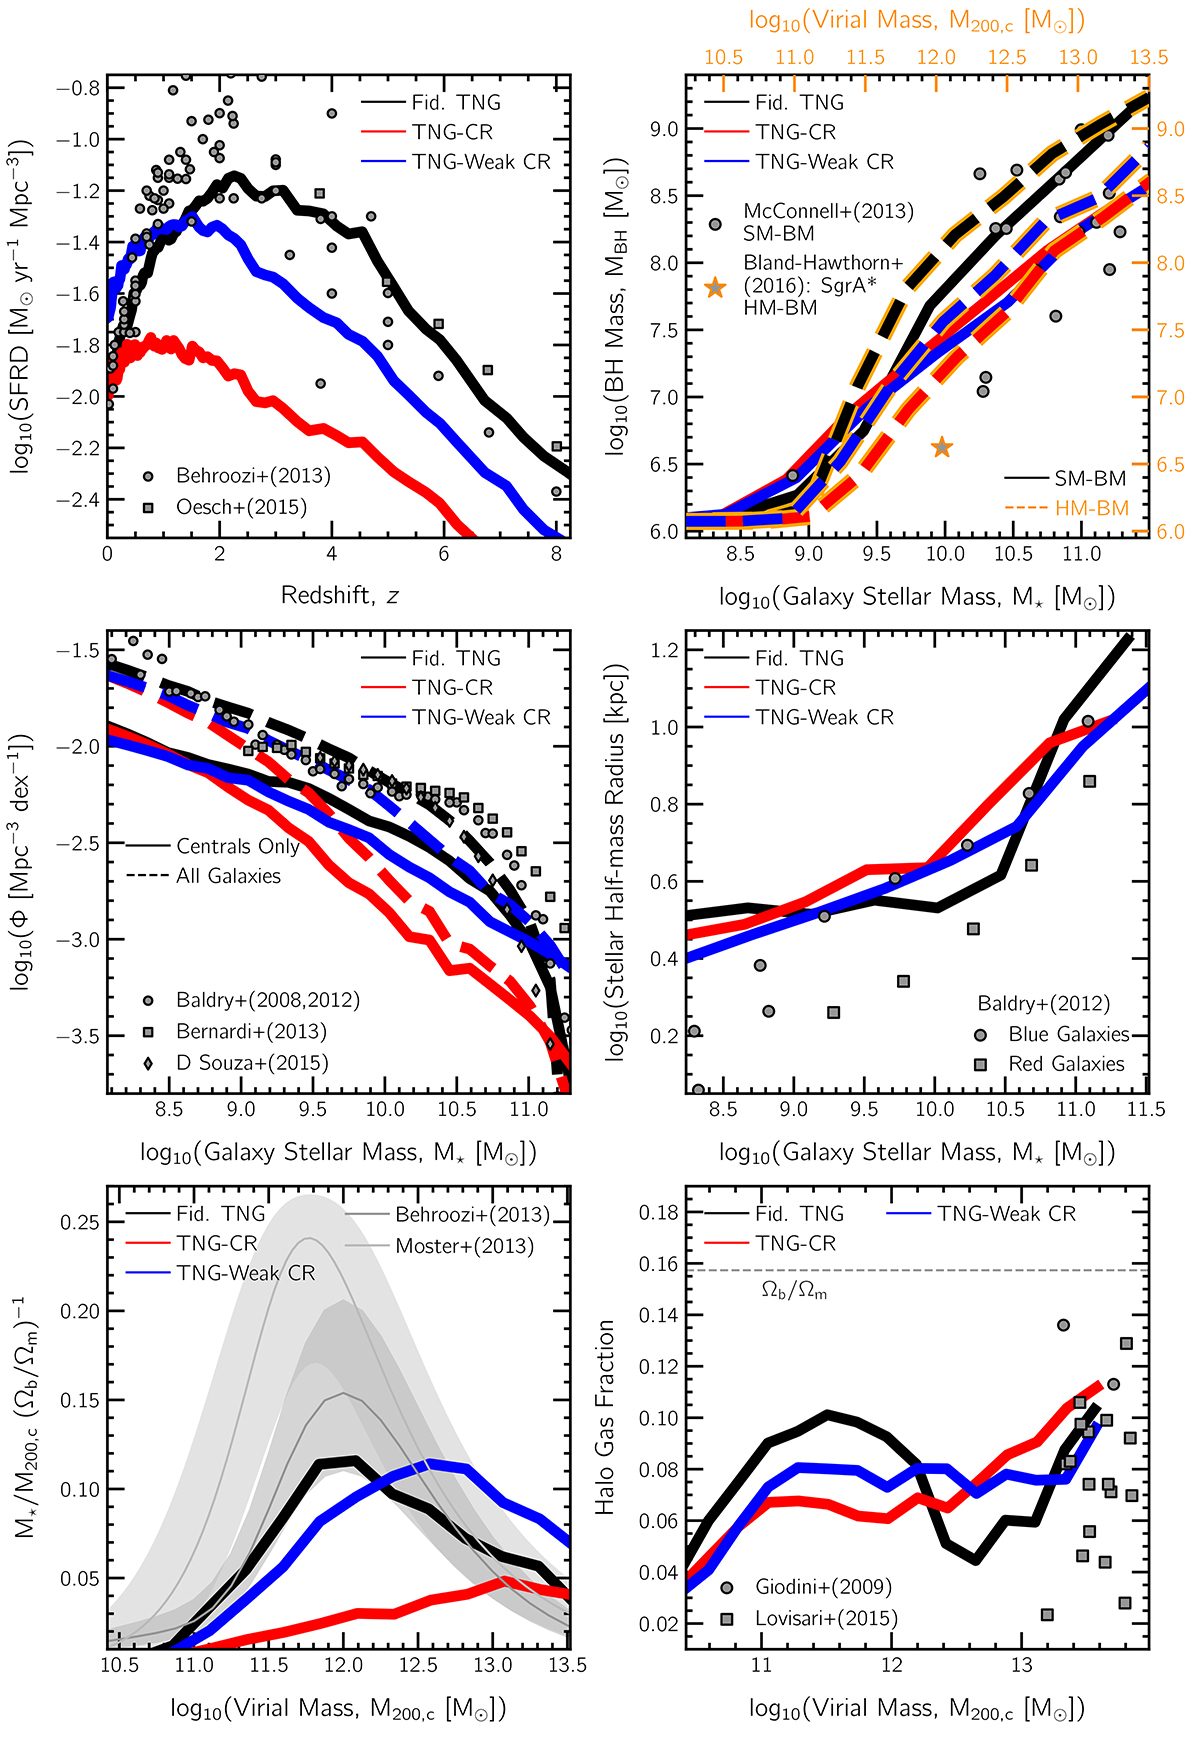
Fig. 3.
Download original image
Summary of galaxy- and halo-scale integrated properties of the galaxy population, all at z = 0, except for the top left panels. In all panels, the black curves correspond to the fiducial TNG model, and the red (blue) curves correspond to TNG-CR (TNG-Weak CR). Scatter points show various observational and empirical constraints: Baldry et al. (2008), Giodini et al. (2009), Baldry et al. (2012), Bernardi et al. (2013), Behroozi et al. (2013), McConnell & Ma (2013), Moster et al. (2013), D’Souza et al. (2015), Oesch et al. (2015), Lovisari et al. (2015), Bland-Hawthorn & Gerhard (2016). The fiducial TNG model is in reasonable agreement with these observational constraints, as this is the set of observables used for calibration. The TNG-CR simulation however produces a reduced number of galaxies at M⋆ ≳ 108.5 M⊙ (center left) as a result of lower star formation rate densities over cosmic epochs (top left). Despite the suppressed stellar mass at fixed halo mass (lower left), and lower black hole masses in general (top right), the galaxy size-stellar mass relation (center right) and halo gas fractions (lower right) are within a factor of ∼ few between TNG-CR and the fiducial TNG case, as well as the different data points (see main text for a more detailed discussion).
Current usage metrics show cumulative count of Article Views (full-text article views including HTML views, PDF and ePub downloads, according to the available data) and Abstracts Views on Vision4Press platform.
Data correspond to usage on the plateform after 2015. The current usage metrics is available 48-96 hours after online publication and is updated daily on week days.
Initial download of the metrics may take a while.