Fig. 8.
Download original image
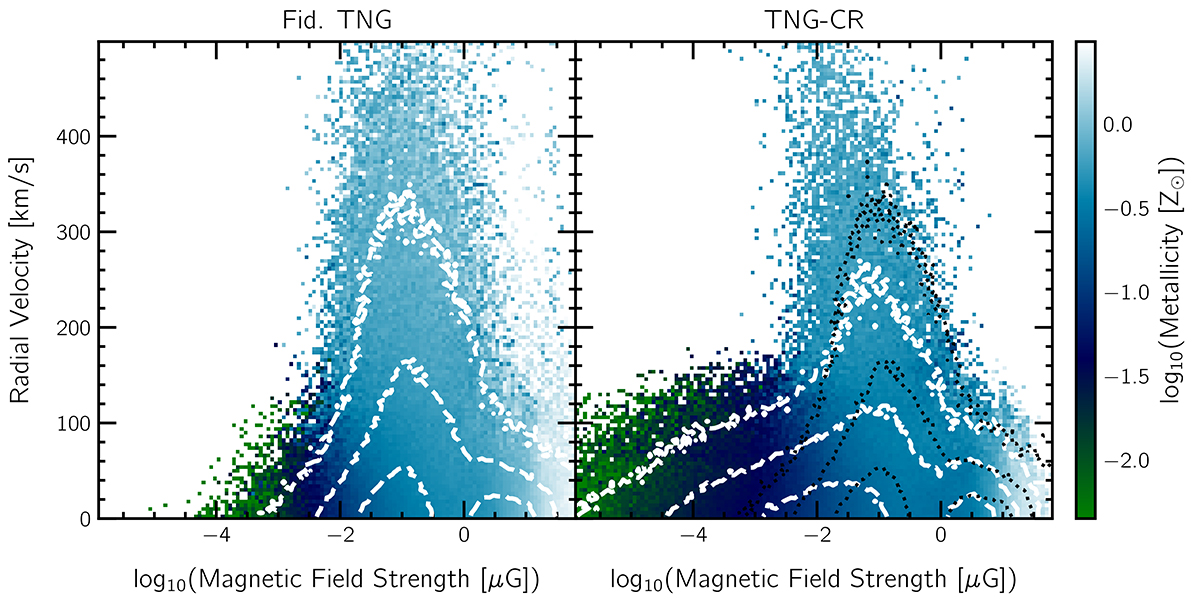
Two-dimensional plots of the radial velocity (y-axis) as functions of the magnetic field strength (x-axis). The background pixels are colored by the mean gas-phase metallicity to compare the Fid. TNG run (left) with TNG-CR (right). We focus exclusively on outflowing gas (vrad ≥ 0) within R200c of the centrals of Milky Way-mass halos, i.e., without satellite gas. The dashed white curves show contours drawn at the [1, 10, 50] % levels, increasing in level toward lower velocities. For ease of visualization, the dotted black curves on the right overplot the contours from the left panel. A greater fraction of outflows gas in Fid. TNG extends to velocities as large as O(100) km s−1, carrying metal enriched gas outward from the galaxy. The Fid. TNG contours are shifted toward slightly larger field strengths, implying the transport of relatively higher magnetized gas by these outflows.
Current usage metrics show cumulative count of Article Views (full-text article views including HTML views, PDF and ePub downloads, according to the available data) and Abstracts Views on Vision4Press platform.
Data correspond to usage on the plateform after 2015. The current usage metrics is available 48-96 hours after online publication and is updated daily on week days.
Initial download of the metrics may take a while.