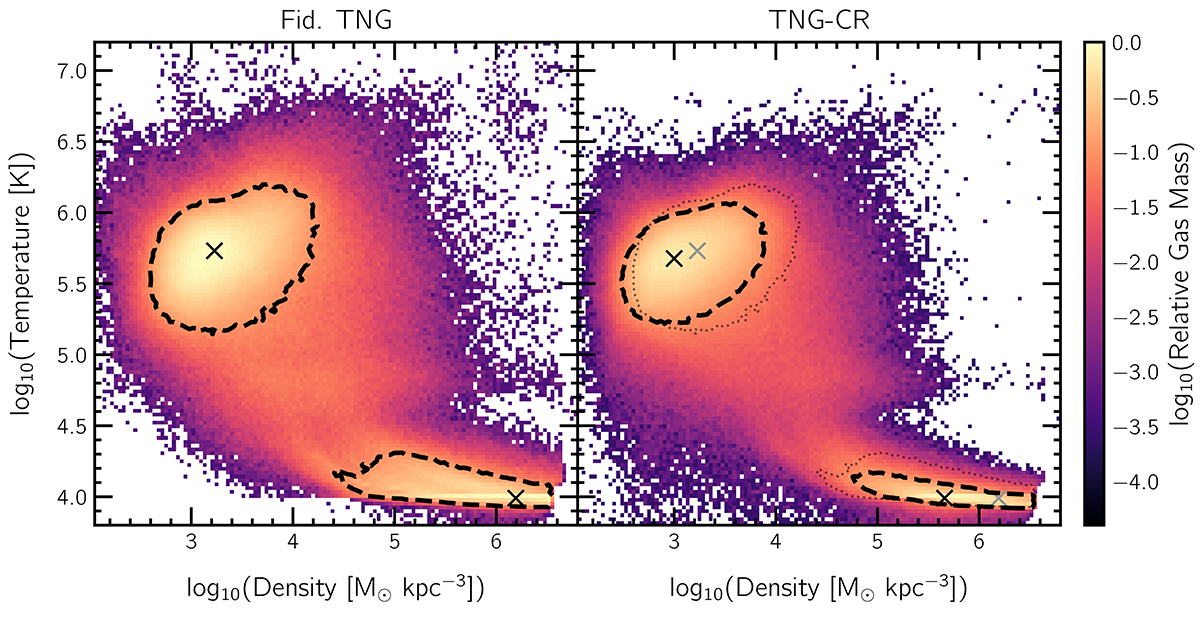
Fig. 9.
Download original image
Phase diagrams of gas within R200c of Milky Way-mass halos in the Fid. TNG run (left) vs. TNG-CR (right). The crosses in both panels correspond to (local) maxima of the cold (< 104.5 K) and hot (> 105.5 K) phases, while dashed curves show contours drawn at the 10% level. For ease of visualization, the dotted curves and gray crosses on the right overplot the corresponding features from the left panel. While the peak density of the cold phase is larger by ∼0.3 dex in Fid. TNG with respect to TNG-CR, the hot phase peak is only offset by ∼0.1 dex in density, and ∼0.05 dex in temperature. Furthermore, contours are more broad in Fid. TNG as compared to TNG-CR, implying larger variation in these gas properties at fixed halo mass.
Current usage metrics show cumulative count of Article Views (full-text article views including HTML views, PDF and ePub downloads, according to the available data) and Abstracts Views on Vision4Press platform.
Data correspond to usage on the plateform after 2015. The current usage metrics is available 48-96 hours after online publication and is updated daily on week days.
Initial download of the metrics may take a while.