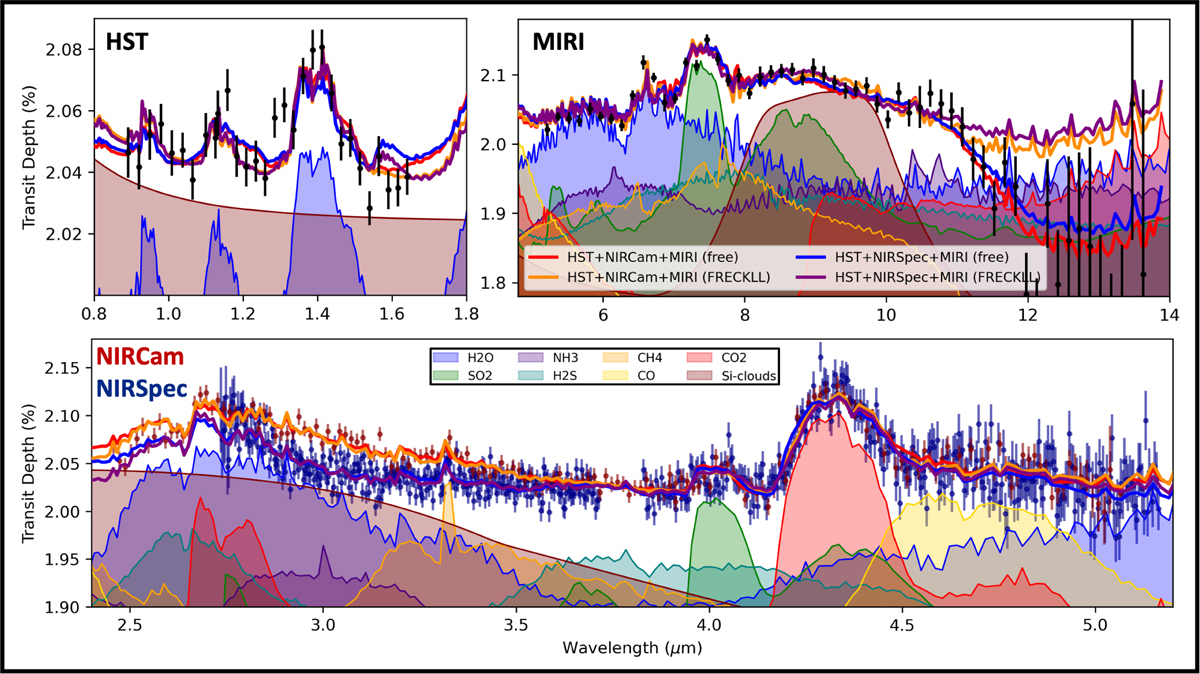
Fig. C.4
Download original image
Spectra and best-fit models for the WASP-107 b study. Red lines indicate the case where the NIRCam data is considered; blue lines indicate the case where the NIRSpec data is considered. We also show the contribution of the different components in the model to the best-fit spectrum for the NIRCam (FRECKLL) case. While the retrieval results are similar, systematic differences exist between the NIRCam and NIRSpec data for λ < 3.7 μm. This difference could be due to remaining instrumental systematics or a time-varying cloud cover. Note that the observations are plotted with the vertical offsets corrected.
Current usage metrics show cumulative count of Article Views (full-text article views including HTML views, PDF and ePub downloads, according to the available data) and Abstracts Views on Vision4Press platform.
Data correspond to usage on the plateform after 2015. The current usage metrics is available 48-96 hours after online publication and is updated daily on week days.
Initial download of the metrics may take a while.