Fig. C.5
Download original image
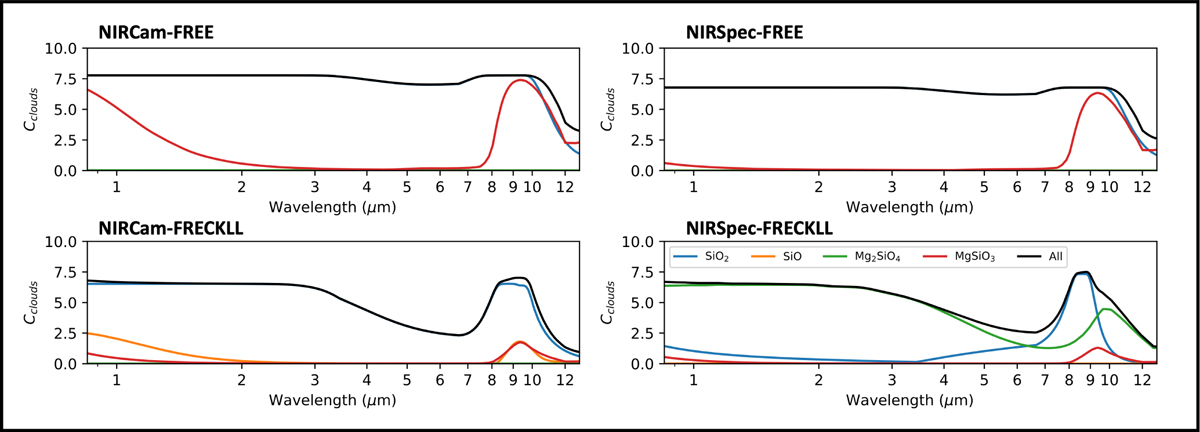
Contribution (Cclouds) of individual cloud species in the best-fit to the WASP-107 b data normalized by the atmospheric scale height (H = 1030 km), showing the contribution of the individual components. In all our retrievals, SiO2 clouds (in blue) seem necessary to explain the sharp opacity rise at λ > 8 μm. However, they do not explain 100% of the feature requiring secondary contributions from either MgSiO3 or Mg2SiO4 particles.
Current usage metrics show cumulative count of Article Views (full-text article views including HTML views, PDF and ePub downloads, according to the available data) and Abstracts Views on Vision4Press platform.
Data correspond to usage on the plateform after 2015. The current usage metrics is available 48-96 hours after online publication and is updated daily on week days.
Initial download of the metrics may take a while.