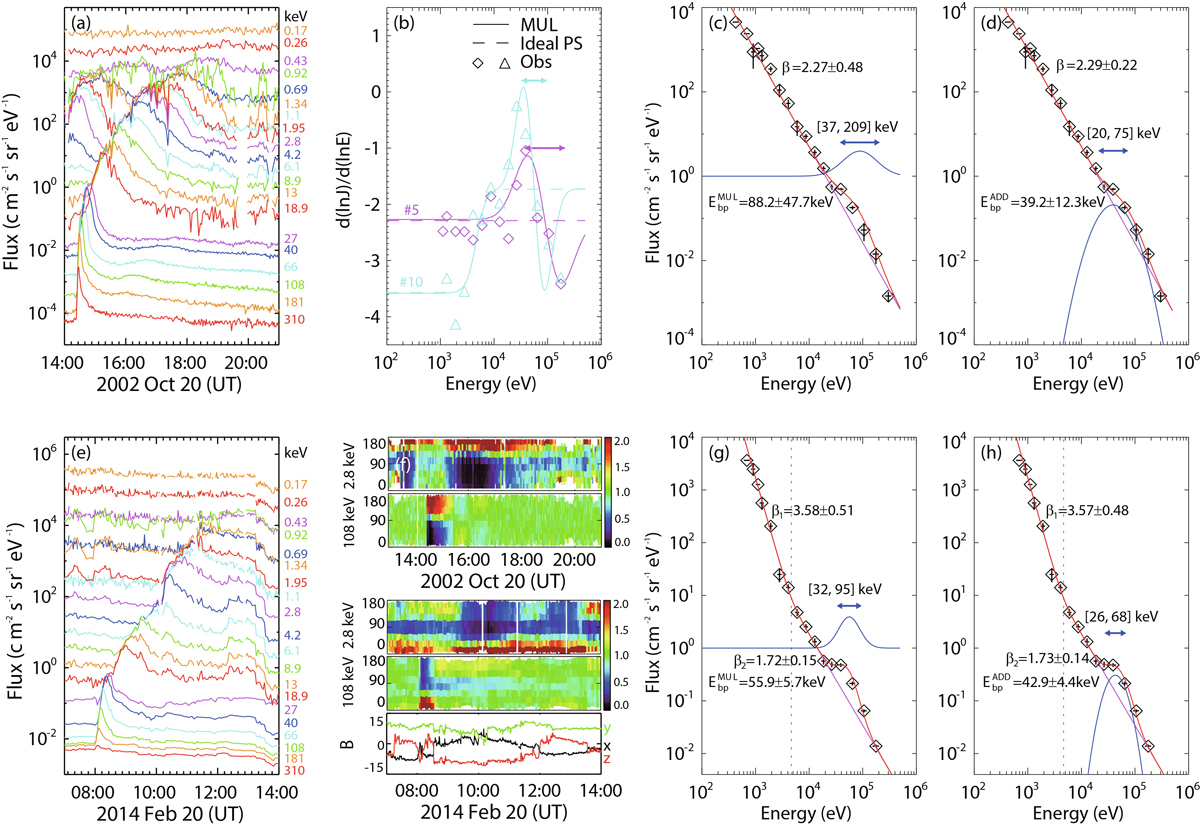
Fig. 1.
Download original image
Overview of the bump SEE events on October 20, 2002 (event 5) and February 20, 2014 (event 10). Panels (a) and (e): Flux time profiles of outward-traveling electrons observed by EESA-L (0.17–1.1 keV, 3 min average), EESA-H (0.92–18.9 keV, 3 min average), and SST (27–310 keV, 90 sec average) for events 5 and 10. Panel (b): Derivative of Δ(lnJ)/Δ(lnE) for event 5 (purple diamonds) and 10 (cyan triangles), where J is the electron background-subtracted peak differential flux. The solid (dashed) line shows the derivative from the MUL (PS) fitting results. Panels (c) and (g): ADD fitting to the observed electron peak flux energy spectrum for events 5 and 10. Panels (d) and (h): MUL fitting. The red lines in panels (c–d) and (g–h) indicate the total fitting results, and the blue (purple) lines represent the Gaussian (PS) portion in fitting. In panels (b–d) and (g–h), the double-ended arrows show the FWHM of the Gaussian portion in the MUL or ADD fittings. Panel (f): Electron pitch-angle distributions normalized at each time bin and 2.8 (108) keV for events 5 and 10, and three components of the IMF vector for event 10. The beamed distributions exhibit higher values (red) in the beaming direction and lower values (indigo) in the other directions, while isotropic distributions exhibit normalized values around one (green) in all directions. The typical peak interval for the ten bump SEE events is about 12 (3) minutes at low energies (high energies).
Current usage metrics show cumulative count of Article Views (full-text article views including HTML views, PDF and ePub downloads, according to the available data) and Abstracts Views on Vision4Press platform.
Data correspond to usage on the plateform after 2015. The current usage metrics is available 48-96 hours after online publication and is updated daily on week days.
Initial download of the metrics may take a while.