Fig. 2.
Download original image
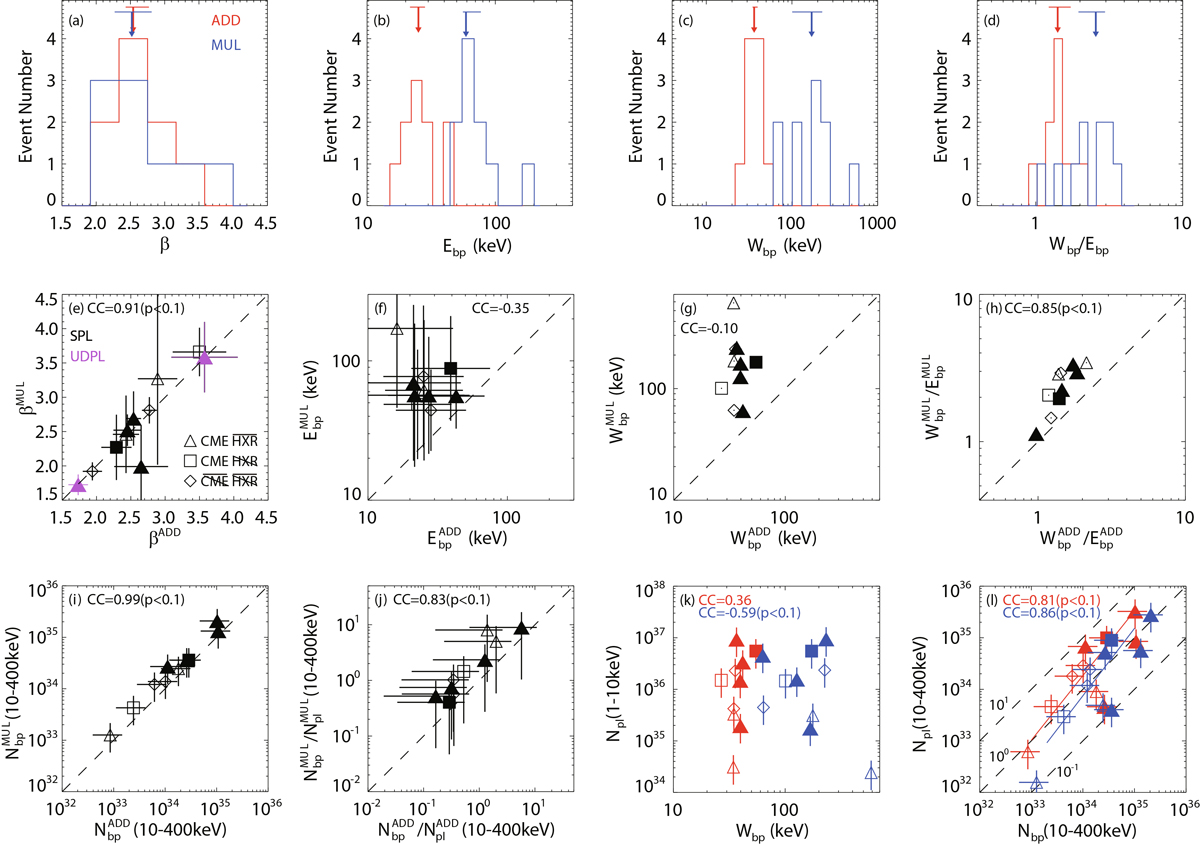
Histograms and scatter diagrams for the spectral parameters of the selected ten bump SEE events. Panels (a–d): Histograms of β, Ebp, Wbp, and Wbp/Ebp estimated from the ADD (red) and MUL (blue) fittings. The arrows with horizontal bars indicate the median values with their first and third quartiles. Panel (a) only plots the nine events (1–9) with a fitted SPL spectral shape for the primary population. Panels (e–h): Scatter plots of β, Ebp, Wbp, and Wbp/Ebp between the ADD and MUL fittings. Panels (i-j): Same format for Nbp and Nbp/Npl at 10–400 keV. In panels (e-j), the dashed lines indicate the 1:1 ratio. Panel (k): Wbp vs. Npl at 1–10 keV. Panel (l): Nbp vs. Npl at 10–400 keV. The dashed lines denote the ratios of 101, 100, and 10−1. The solid red (blue) line denotes the estimated linear regression of ![]() (
(![]() ) for the ten bump events. In panels (e-l), the triangles indicate the bump SEE events associated with west limb CMEs and with HXR flares or no available HXR measurements, the squares represent the SEE events with west limb CMEs and no HXR flares (when measurements are available), and the diamonds show the events without west limb CMEs and HXR flares (when measurements are available), or events without available CME and HXR measurements. The solid (open) symbols indicate events associated with (without) type II radio bursts. We used the logarithm of the electron number to calculate the CCs regarding the electron number.
) for the ten bump events. In panels (e-l), the triangles indicate the bump SEE events associated with west limb CMEs and with HXR flares or no available HXR measurements, the squares represent the SEE events with west limb CMEs and no HXR flares (when measurements are available), and the diamonds show the events without west limb CMEs and HXR flares (when measurements are available), or events without available CME and HXR measurements. The solid (open) symbols indicate events associated with (without) type II radio bursts. We used the logarithm of the electron number to calculate the CCs regarding the electron number.
Current usage metrics show cumulative count of Article Views (full-text article views including HTML views, PDF and ePub downloads, according to the available data) and Abstracts Views on Vision4Press platform.
Data correspond to usage on the plateform after 2015. The current usage metrics is available 48-96 hours after online publication and is updated daily on week days.
Initial download of the metrics may take a while.