Fig. 4.
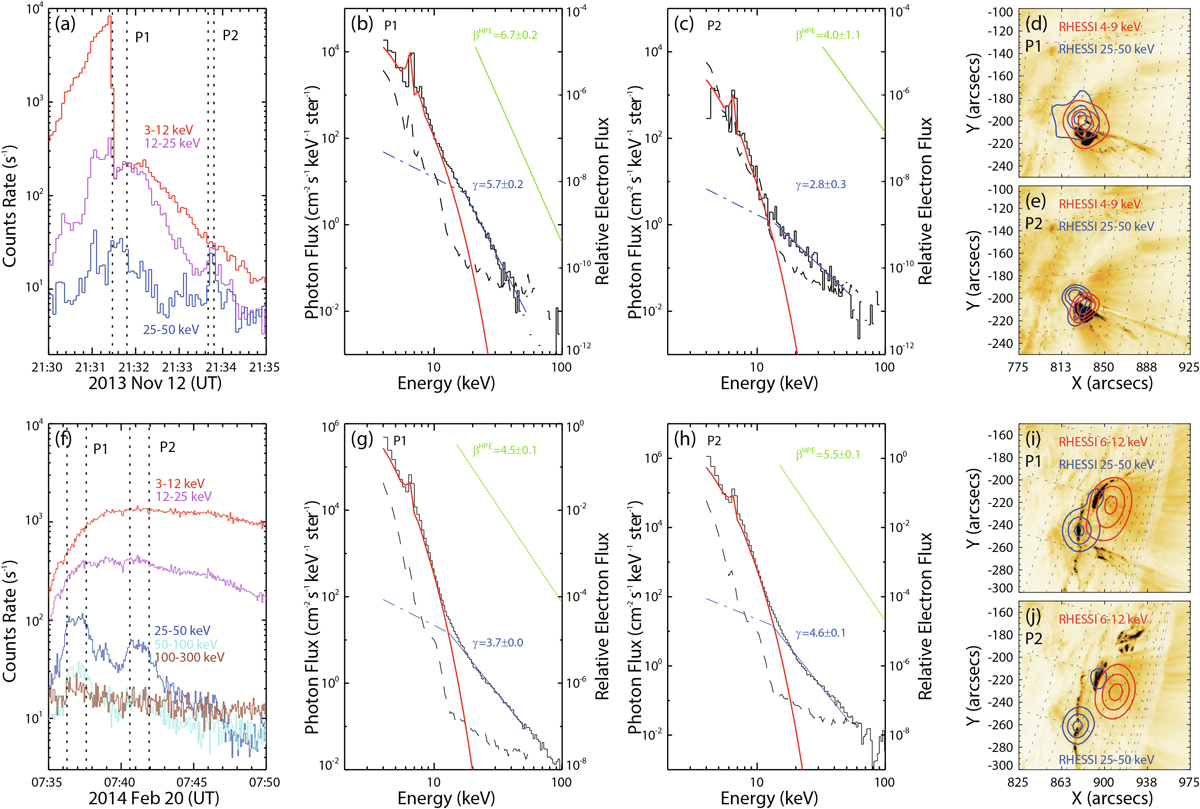
Download original image
RHESSI HXR flares associated with the bump SEE events on November 12, 2013 (event 9; top panels) and February 20, 2014 (event 10; bottom panels). Panels (a) and (f): X-ray light curves. The vertical dashed lines mark the two emission peak intervals (P1 and P2) of the HXR flare. Panels (b) and (g): Spectrum of the photon peak flux vs. energy (solid black line) measured during P1. The solid blue (red) line represents an SPL fit (the thermal fit) to observations at energies above 20 keV (below 15 keV), and the dashed blue line shows an SPL with a fixed index of 1.5 at energies below 20 keV as an approximation of nonthermal emissions at these energies. The green line represents the estimated SPL spectrum of HPEs (multiplied by an arbitrary factor for display). Panels (c) and (h): Same format for P2. Panels (d) and (i): RHESSI CLEAN X-ray intensity contours at levels of 40%, 60%, and 80% measured during P1, plotted on the SDO/AIA image at 171 Å. Panels (e) and (j): Same format for P2.
Current usage metrics show cumulative count of Article Views (full-text article views including HTML views, PDF and ePub downloads, according to the available data) and Abstracts Views on Vision4Press platform.
Data correspond to usage on the plateform after 2015. The current usage metrics is available 48-96 hours after online publication and is updated daily on week days.
Initial download of the metrics may take a while.