Fig. 5.
Download original image
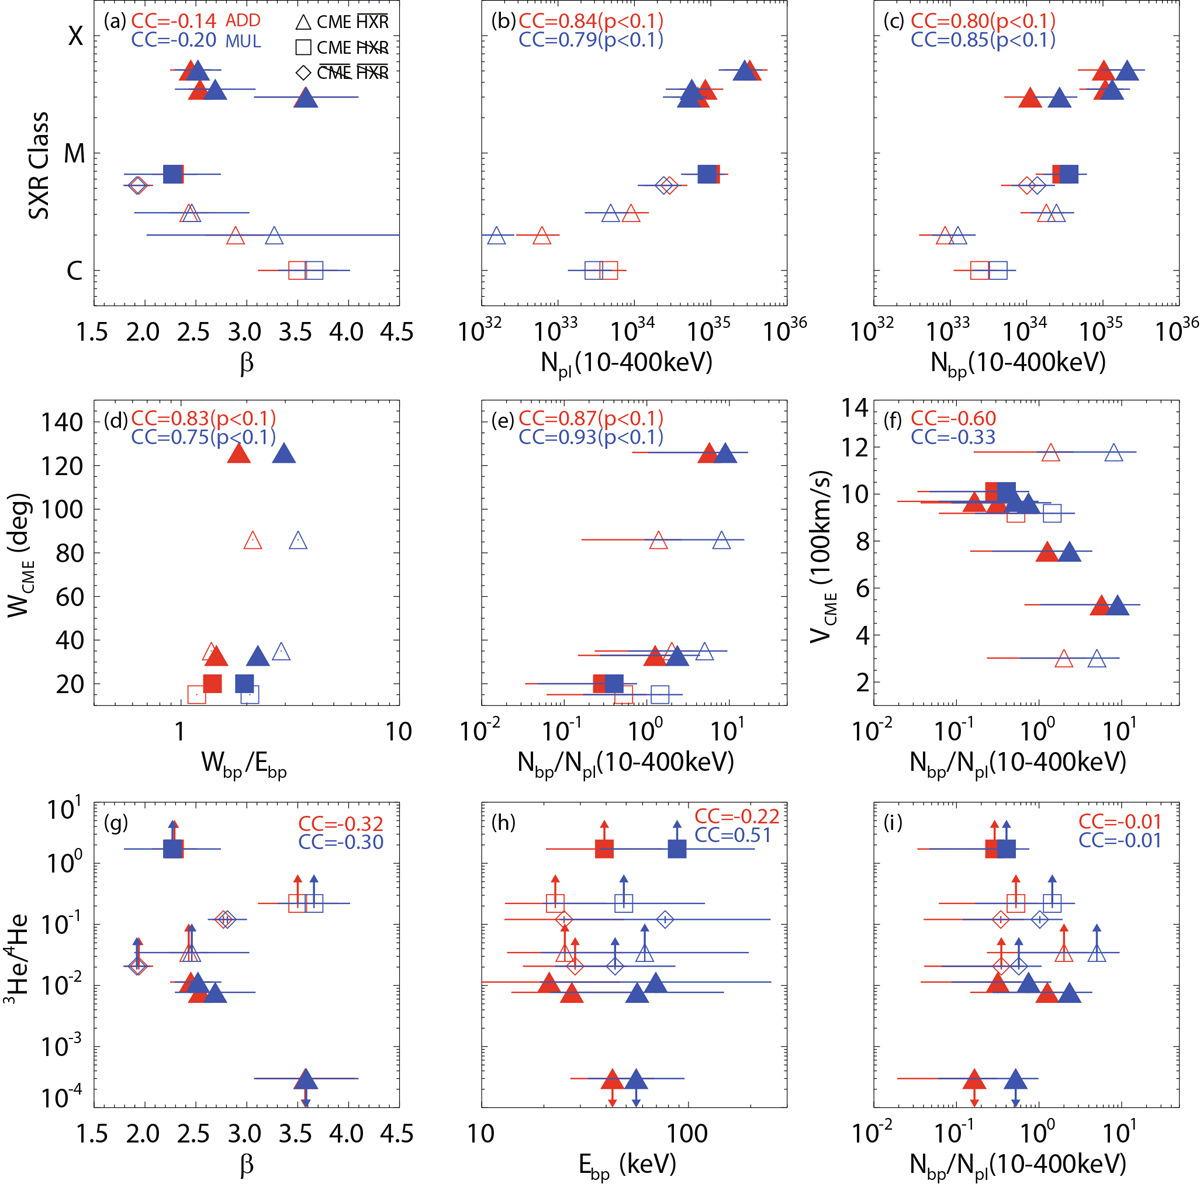
Scatter diagrams of the parameters between the ten bump SEE events and the associated solar phenomena, including SXR flares (top), west limb CMEs (middle), and 3He/4He (bottom). Panels (a–c): SXR class vs. β, Npl at 10–400 keV and Nbp at 10–400 keV. Panels (d–e): CME width vs. Wbp/Ebp, Nbp/Npl at 10–400 keV. Panel (f): CME speed vs. Nbp/Npl at 10–400 keV. Panels (g–h): 3He/4He ratio vs. β and Ebp Panel (i): 3He/4He ratio vs. Nbp/Npl at 10–400 keV. The upward (downward) arrows indicate the underestimated (overestimated) 3He/4He ratio. In all panels, blue (red) shows the SEE parameters from the MUL (ADD) fitting. The symbols represent the same as in Figure 2. We used the logarithm of the electron number and of 3He/4He ratio to calculate the corresponding CCs.
Current usage metrics show cumulative count of Article Views (full-text article views including HTML views, PDF and ePub downloads, according to the available data) and Abstracts Views on Vision4Press platform.
Data correspond to usage on the plateform after 2015. The current usage metrics is available 48-96 hours after online publication and is updated daily on week days.
Initial download of the metrics may take a while.