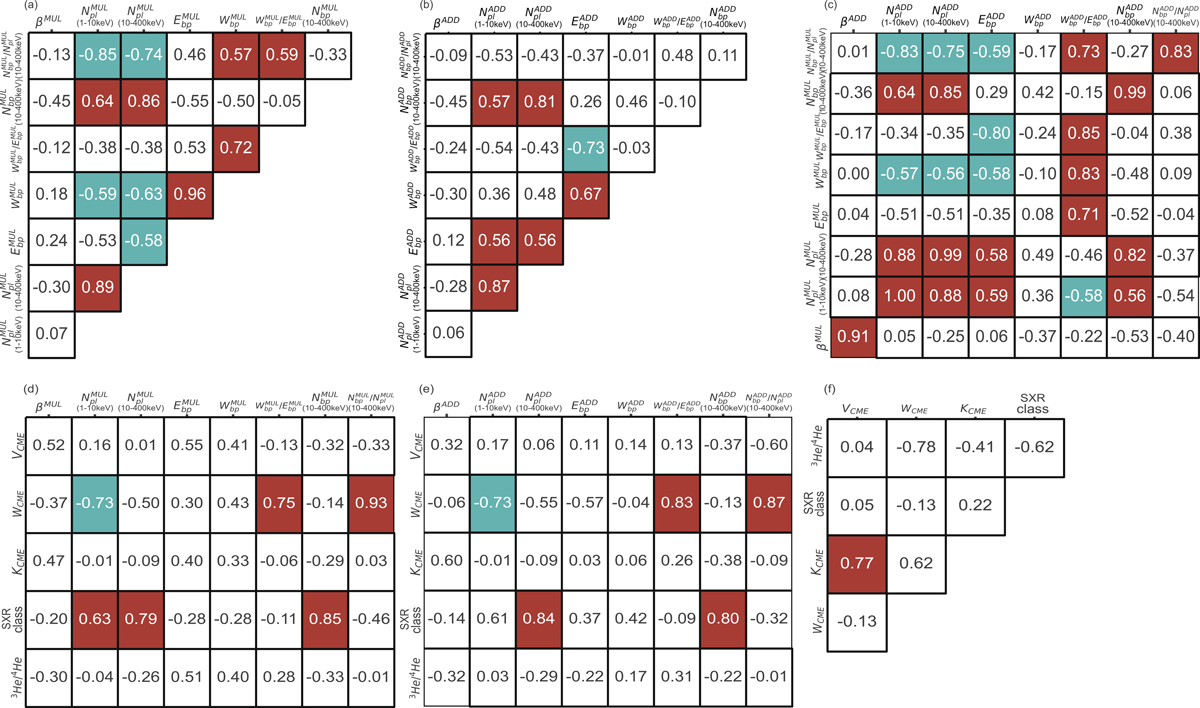
Fig. 6.
Download original image
Correlograms of the parameters between the ten bump SEE events and the associated solar phenomena including SXR flares, west limb CMEs, and 3He/4He. Panel (a): Autocorrelation matrix between the SEE parameters estimated from the ADD fitting. Panel (b): Same format for the MUL fitting. Panel (c): Correlation matrix of SEE parameters between the ADD and MUL fittings. Panel (d): Correlation matrix between the ADD SEE parameters and the parameters of the associated solar phenomena. Panel (e): Same format for the MUL fitting. Panel (f): Autocorrelation matrix between the parameters of the solar phenomena. The CCs are listed in the center of each cell. The cell is color-coded when the CC is statistically significant (p < 0.1). Red (blue) indicates a positive (negative) correlation. For a statistically insignificant CC (p ≥ 0.1), its cell is shown in white. We used the logarithm of the electron number and of 3He/4He ratio to calculate the corresponding CCs.
Current usage metrics show cumulative count of Article Views (full-text article views including HTML views, PDF and ePub downloads, according to the available data) and Abstracts Views on Vision4Press platform.
Data correspond to usage on the plateform after 2015. The current usage metrics is available 48-96 hours after online publication and is updated daily on week days.
Initial download of the metrics may take a while.