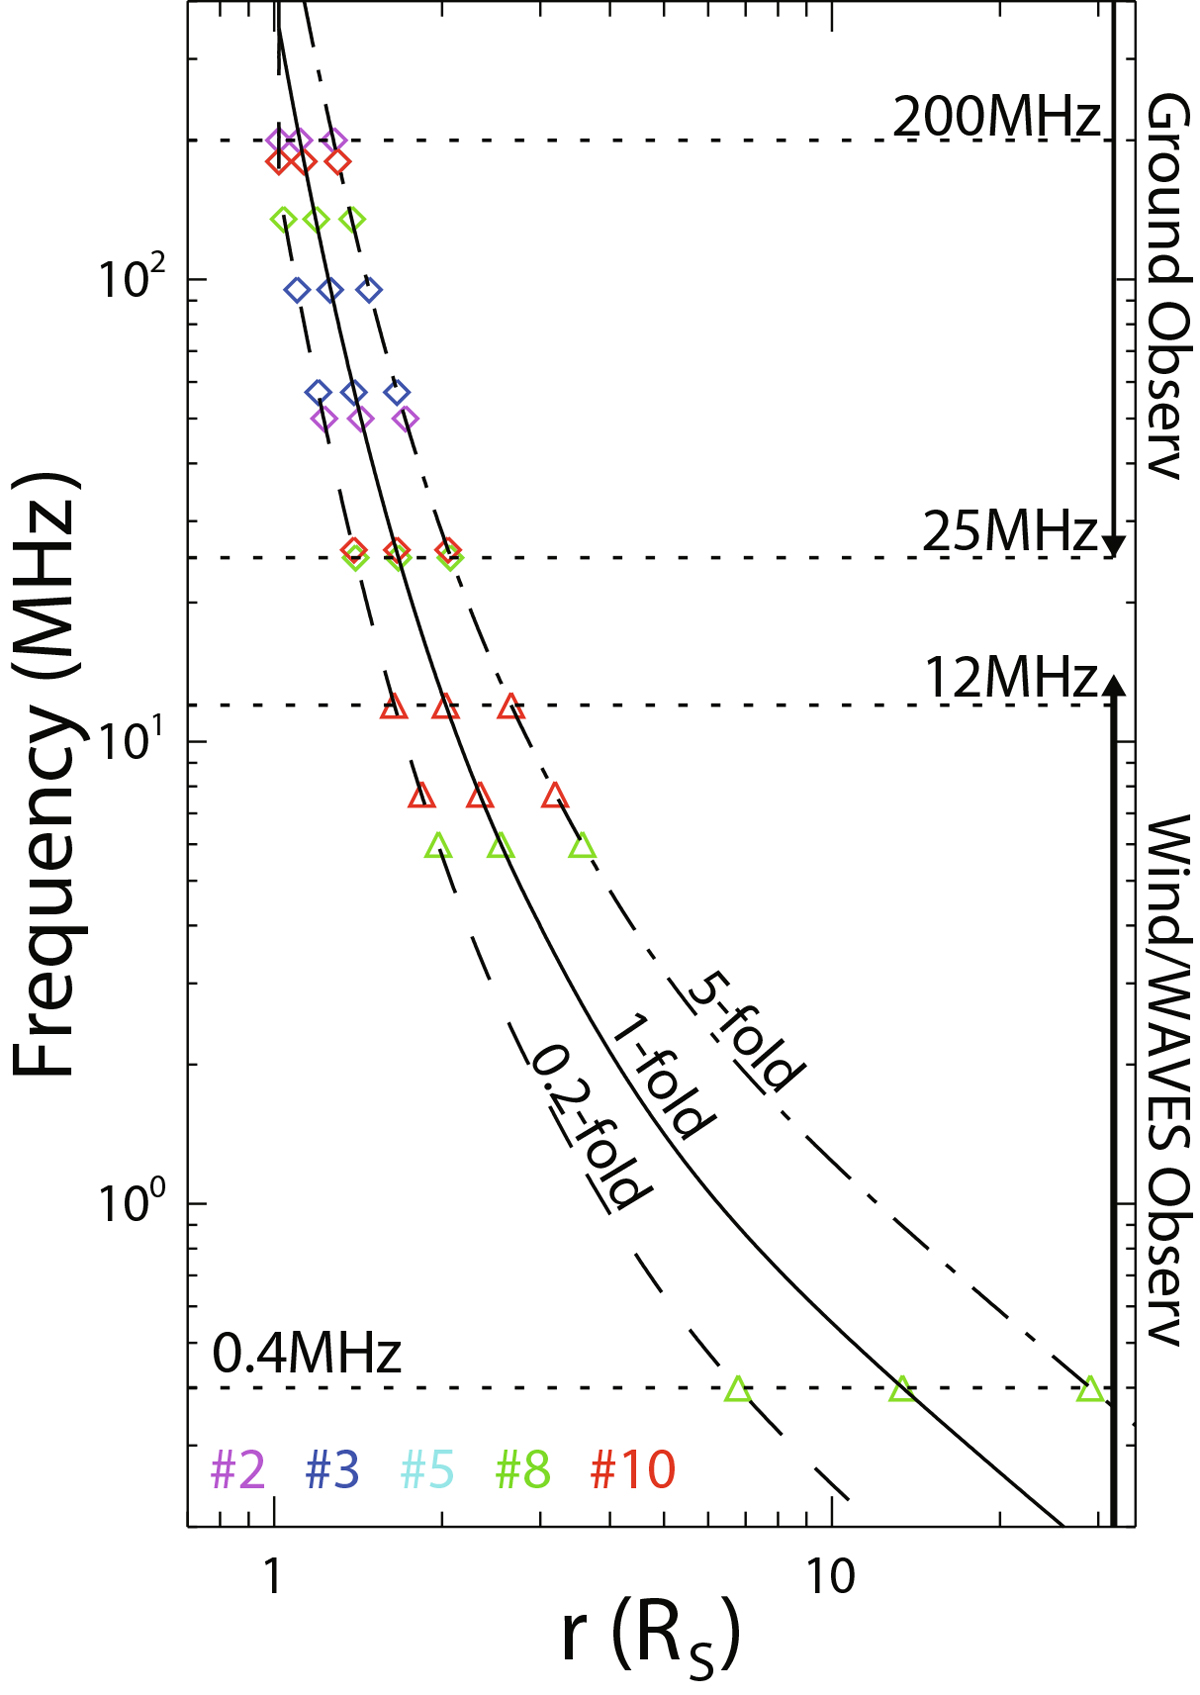
Fig. 7.
Download original image
Variation in the type II burst height r with plasma frequency estimated from the electron density model of Equation (3). The dashed, dotted, and dash-dotted curves represent the 0.2-fold, 1-fold, and 5-fold models, respectively. The colored symbols indicate the lower and upper bounds of the burst frequency range observed by ground-based stations and by Wind/WAVES for different bump SEE events.
Current usage metrics show cumulative count of Article Views (full-text article views including HTML views, PDF and ePub downloads, according to the available data) and Abstracts Views on Vision4Press platform.
Data correspond to usage on the plateform after 2015. The current usage metrics is available 48-96 hours after online publication and is updated daily on week days.
Initial download of the metrics may take a while.