Fig. 2
Download original image
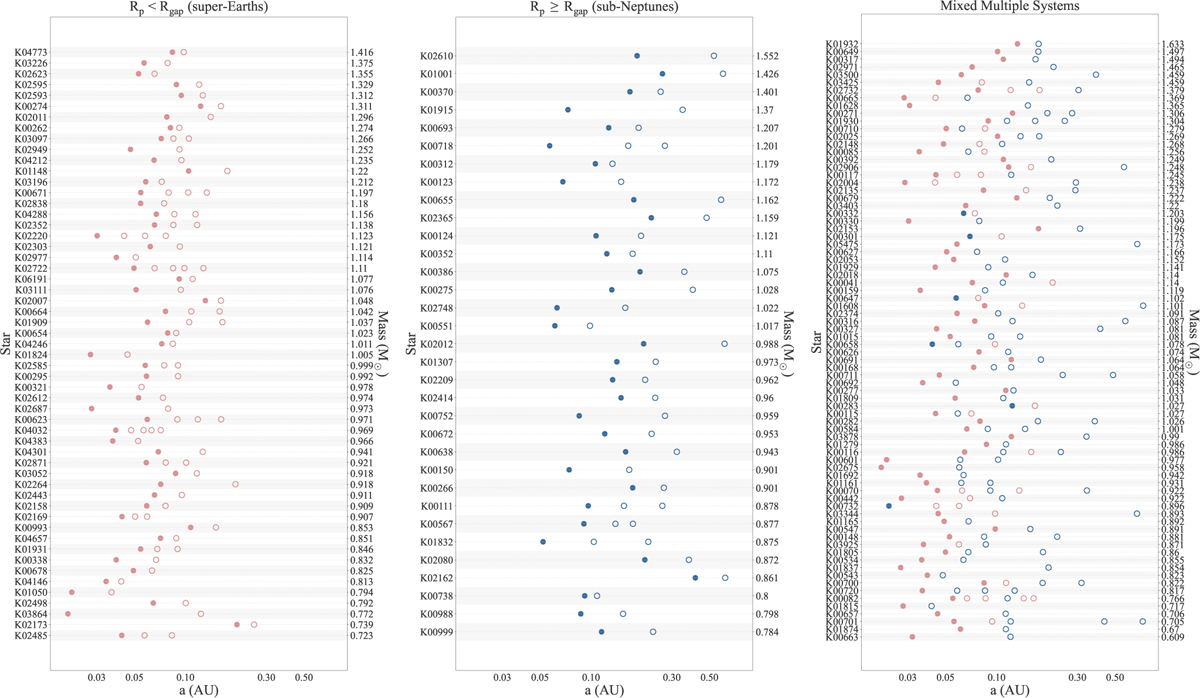
Architecture of the three population samples of all multis studied in this paper. The left panel represents super-Earths, the middle panel represents sub-Neptunes, and the right panel represents mixed systems containing both super-Earths and sub-Neptunes within the same system. The point colors and styles are the same as those in Fig. 1. Each row represents a system, ordered from top to bottom by decreasing stellar mass. A trend can be observed: As stellar mass increases from low to high, the semimajor axis shifts from smaller to larger values.
Current usage metrics show cumulative count of Article Views (full-text article views including HTML views, PDF and ePub downloads, according to the available data) and Abstracts Views on Vision4Press platform.
Data correspond to usage on the plateform after 2015. The current usage metrics is available 48-96 hours after online publication and is updated daily on week days.
Initial download of the metrics may take a while.