Fig. 9.
Download original image
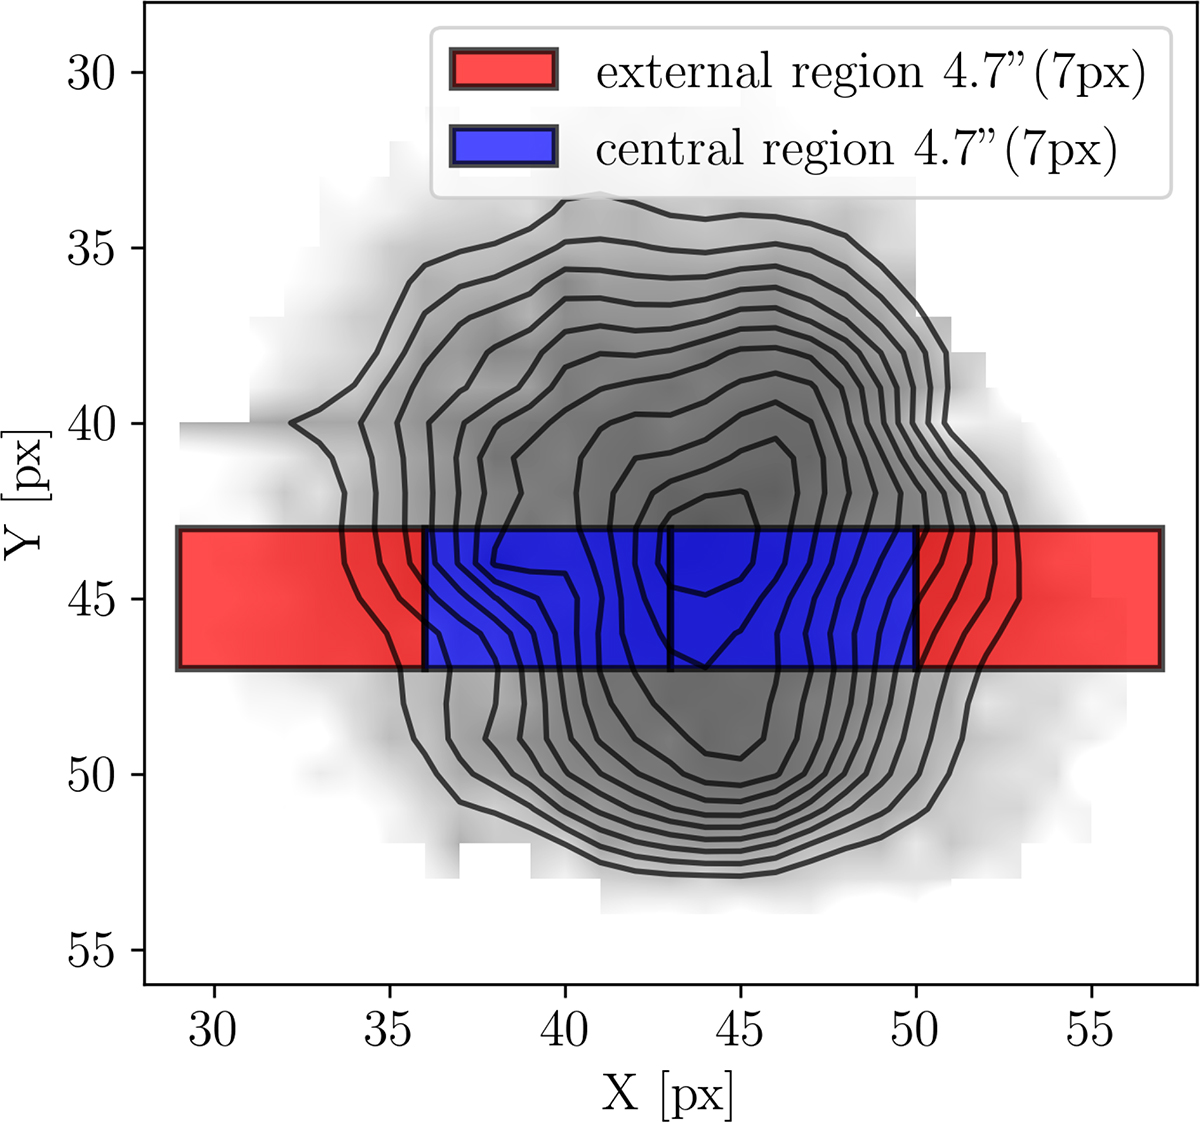
Simulated slit in the IFU data following the EFOSC2 long-slit observations of S02 compared to the [O III]λ5007 emission line map indicated by the black contours. The simulated slit was divided into four sections of equal area, where the first and fourth represent the external region in red, and the second and third represent the central region in blue, from left to right, respectively.
Current usage metrics show cumulative count of Article Views (full-text article views including HTML views, PDF and ePub downloads, according to the available data) and Abstracts Views on Vision4Press platform.
Data correspond to usage on the plateform after 2015. The current usage metrics is available 48-96 hours after online publication and is updated daily on week days.
Initial download of the metrics may take a while.