Open Access
Fig. 2.
Download original image
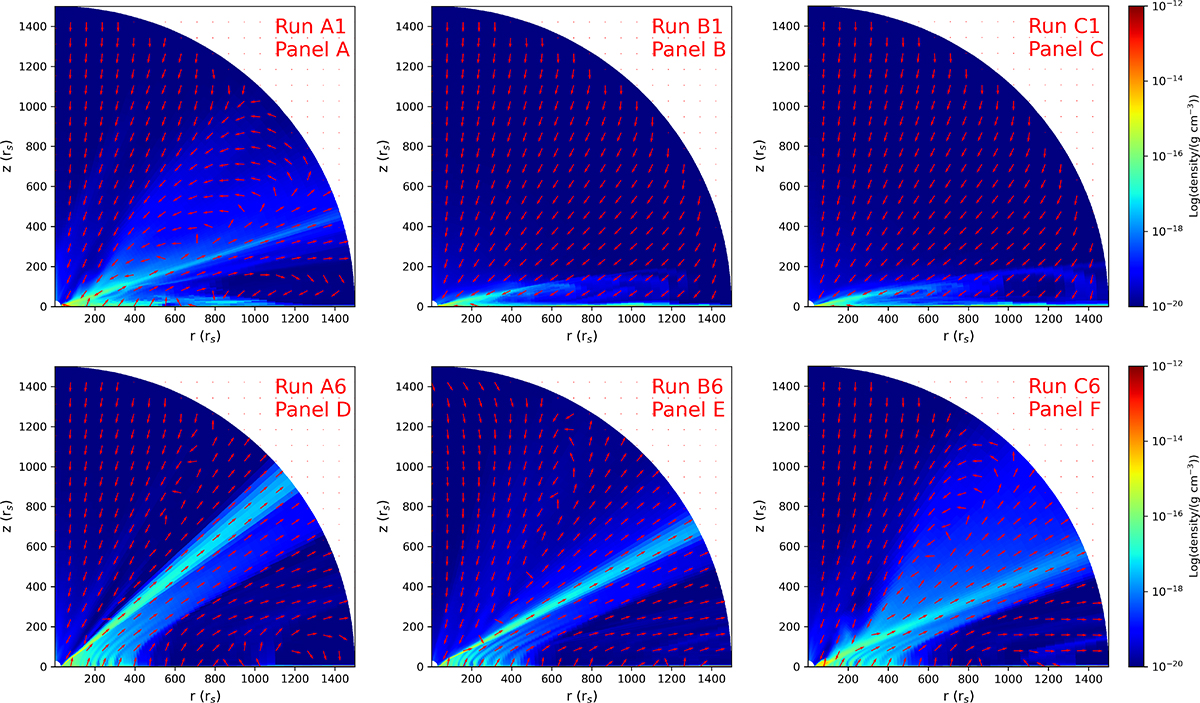
Two-dimensional structure of winds for runs A1, B1, C1, A6, B6, and C6. In panels A–F, colors mean the density distribution and arrows mean the poloidal velocity. The structure of winds is obtained by averaging over the time interval of 1.0–1.5 Torb.
Current usage metrics show cumulative count of Article Views (full-text article views including HTML views, PDF and ePub downloads, according to the available data) and Abstracts Views on Vision4Press platform.
Data correspond to usage on the plateform after 2015. The current usage metrics is available 48-96 hours after online publication and is updated daily on week days.
Initial download of the metrics may take a while.