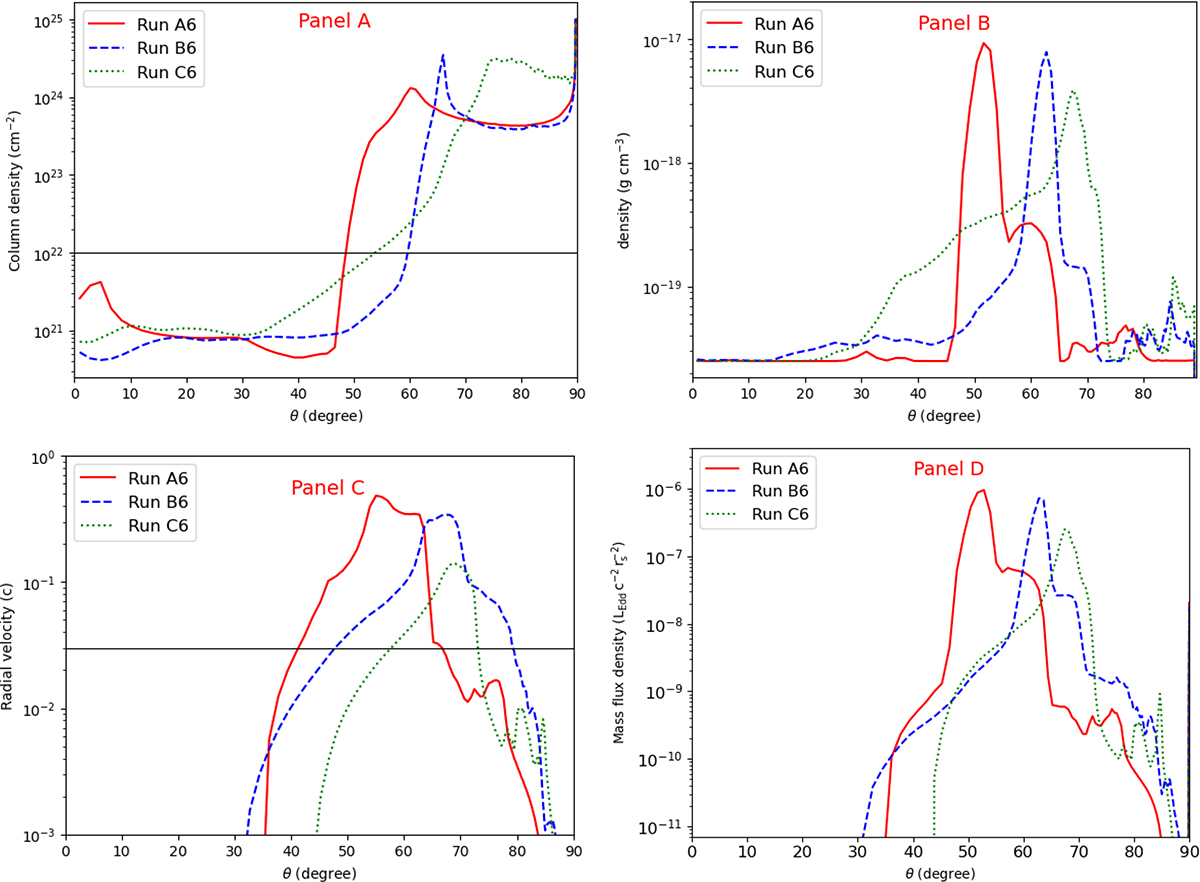
Fig. 6.
Download original image
Angular profiles of time-averaged variables. Panel (A): the angular profiles of the column density; Panel (B): the angular profiles of the density at r = 1500rs; Panel (C): the angular profiles of the radial velocity at r = 1500rs; Panel (D): the angular profiles of the mass flux density at r = 1500rs. In panel (A), the horizontal line means the column density of 1022 cm−2. In panel (C), the horizontal line means the velocity of 104 km s−1.
Current usage metrics show cumulative count of Article Views (full-text article views including HTML views, PDF and ePub downloads, according to the available data) and Abstracts Views on Vision4Press platform.
Data correspond to usage on the plateform after 2015. The current usage metrics is available 48-96 hours after online publication and is updated daily on week days.
Initial download of the metrics may take a while.