Fig. 10
Download original image
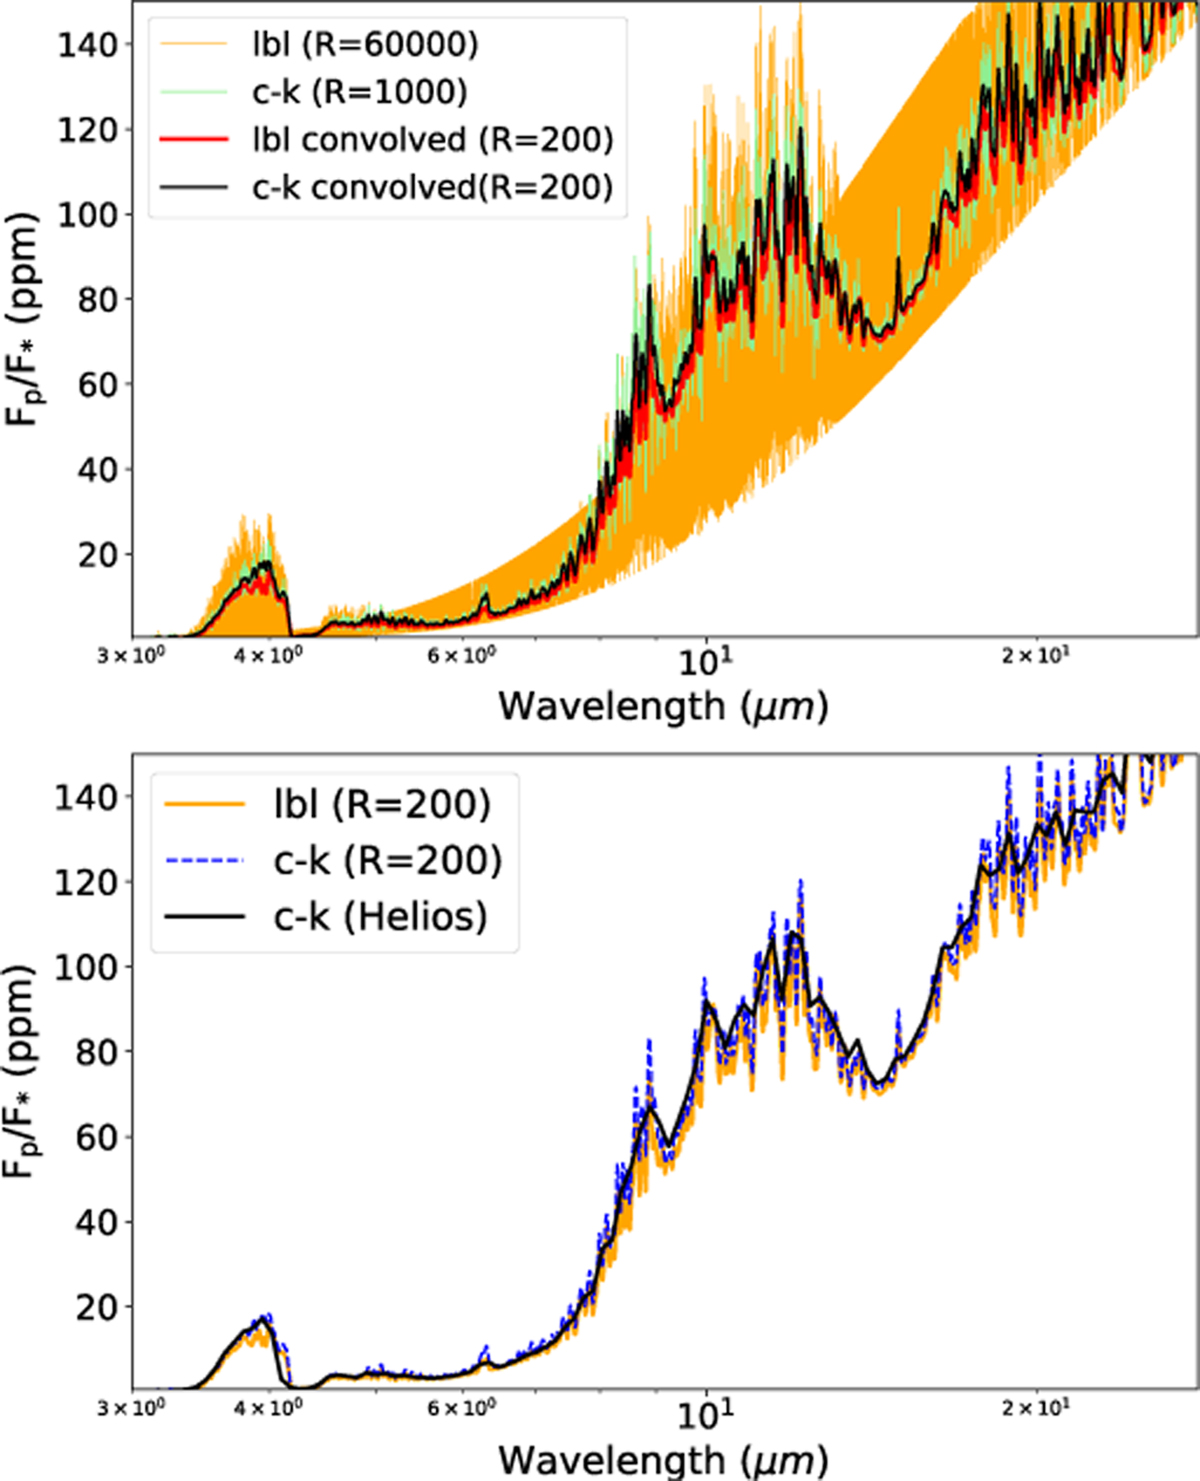
Thermal emission spectrum for a simulation with surface pressure of 1 bar, redox state of fO2 − IW = 2, and ac = 10−6. Top: comparison between the line-by-line radiative transfer method at R = 60 000 and the correlated-k method at R = 1000, both convolved to R = 200. Bottom: comparison of convolved spectra from both line-by-line and correlated-k methods generated using petitRADTRANS, along with the output spectrum from our framework. All three approaches show negligible differences when predicting photometric fluxes in the JWST MIRI broad-band filters (see text for more details).
Current usage metrics show cumulative count of Article Views (full-text article views including HTML views, PDF and ePub downloads, according to the available data) and Abstracts Views on Vision4Press platform.
Data correspond to usage on the plateform after 2015. The current usage metrics is available 48-96 hours after online publication and is updated daily on week days.
Initial download of the metrics may take a while.