Fig. 12
Download original image
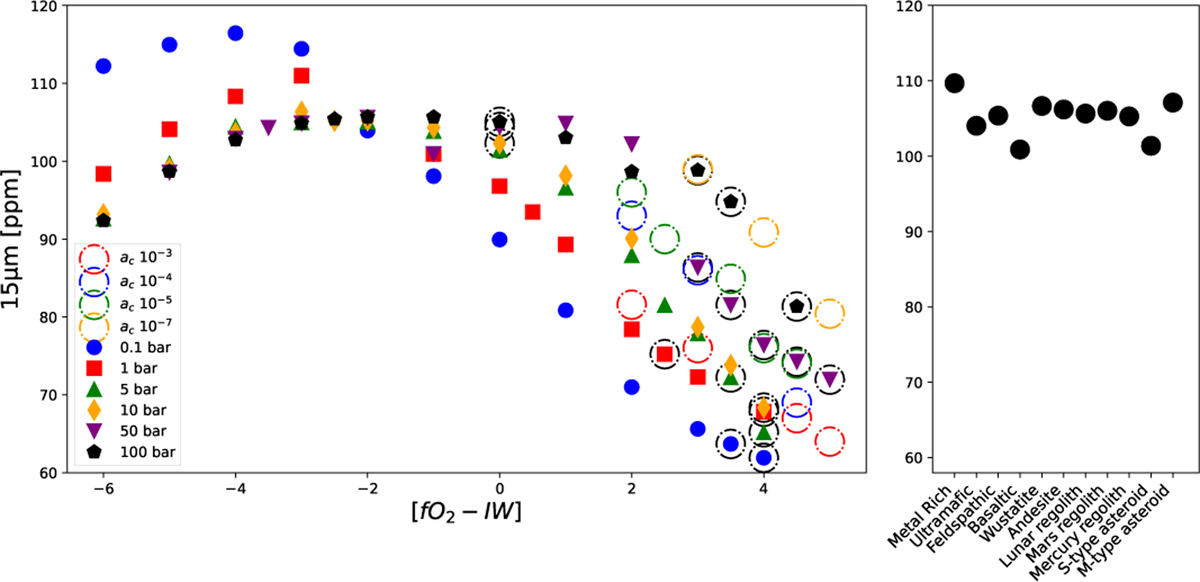
Left: 15 μm band secondary eclipse depth as a function of fO2 across the surface pressure grid space with main graphite activity ac = 10−6. Dashed circles indicate stable atmospheres, as approximated using the methodology described in Section 5. Symbols in black indicate the stable atmospheres of all surface pressure scenarios for the main graphite activity value, while all other colors indicate the variability in graphite content for a 100 bar atmosphere. Right: 15 μm band for the bare-rock with various surface material scenarios, plotted on the same vertical scale as the left panel.
Current usage metrics show cumulative count of Article Views (full-text article views including HTML views, PDF and ePub downloads, according to the available data) and Abstracts Views on Vision4Press platform.
Data correspond to usage on the plateform after 2015. The current usage metrics is available 48-96 hours after online publication and is updated daily on week days.
Initial download of the metrics may take a while.