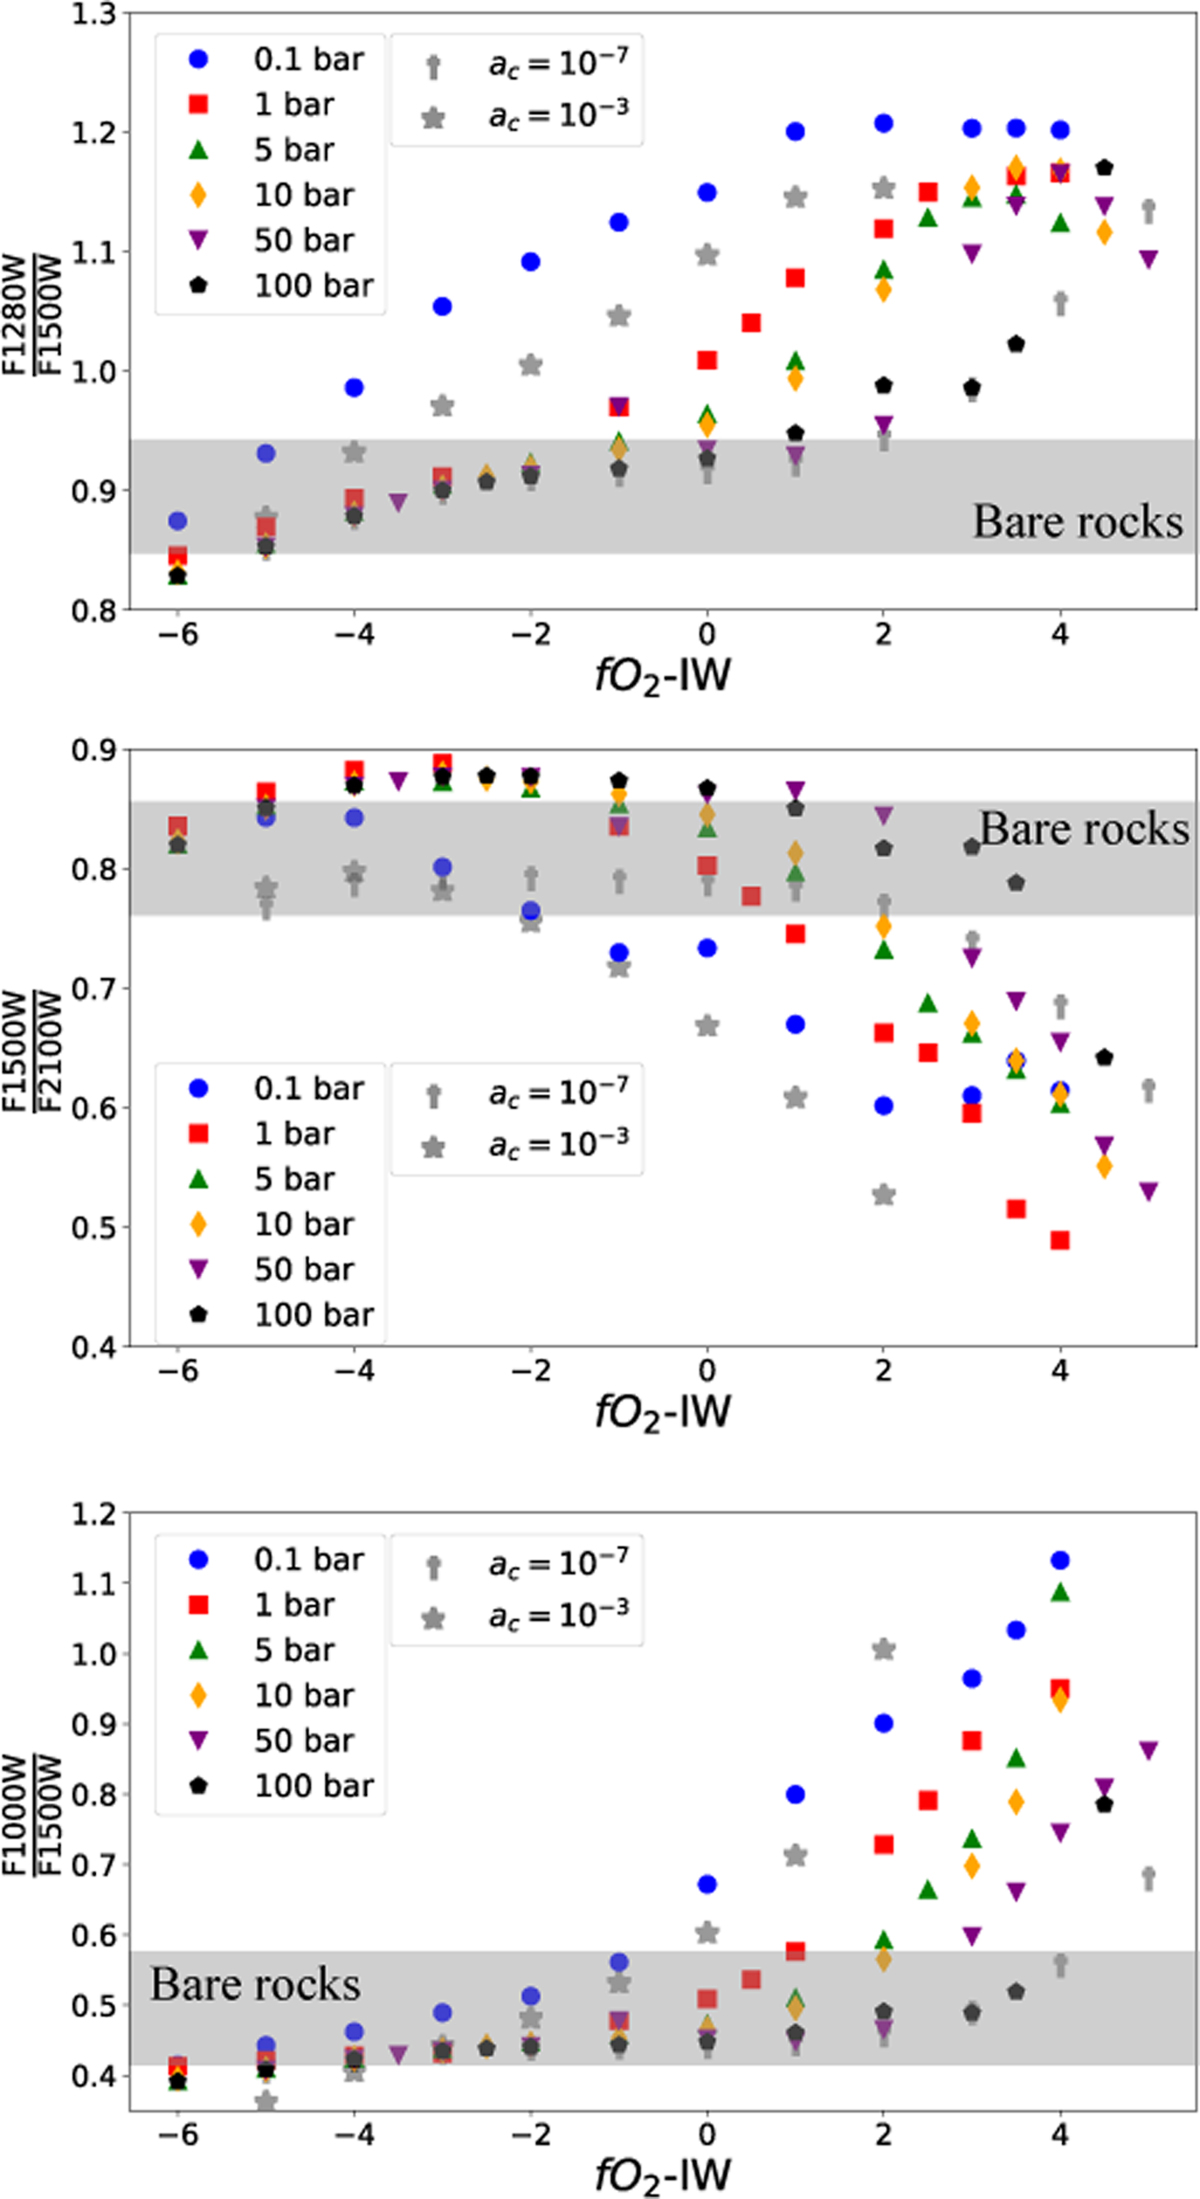
Fig. 13
Download original image
Photometric band ratios for various surface pressures as a function of oxygen fugacity at ac = 10−6. We overplot the extreme values of graphite activity, ac, 10−7 and 10−3 for 100bar surface pressure. Top: ratio of the 12.8 μm to 15 μm spectral bands. Middle: ratio of the 15 μm to 21 μm. Bottom: ratio of the 10 μm to 15 μm. Variation in surface pressure is indicated with different colored shapes.
Current usage metrics show cumulative count of Article Views (full-text article views including HTML views, PDF and ePub downloads, according to the available data) and Abstracts Views on Vision4Press platform.
Data correspond to usage on the plateform after 2015. The current usage metrics is available 48-96 hours after online publication and is updated daily on week days.
Initial download of the metrics may take a while.