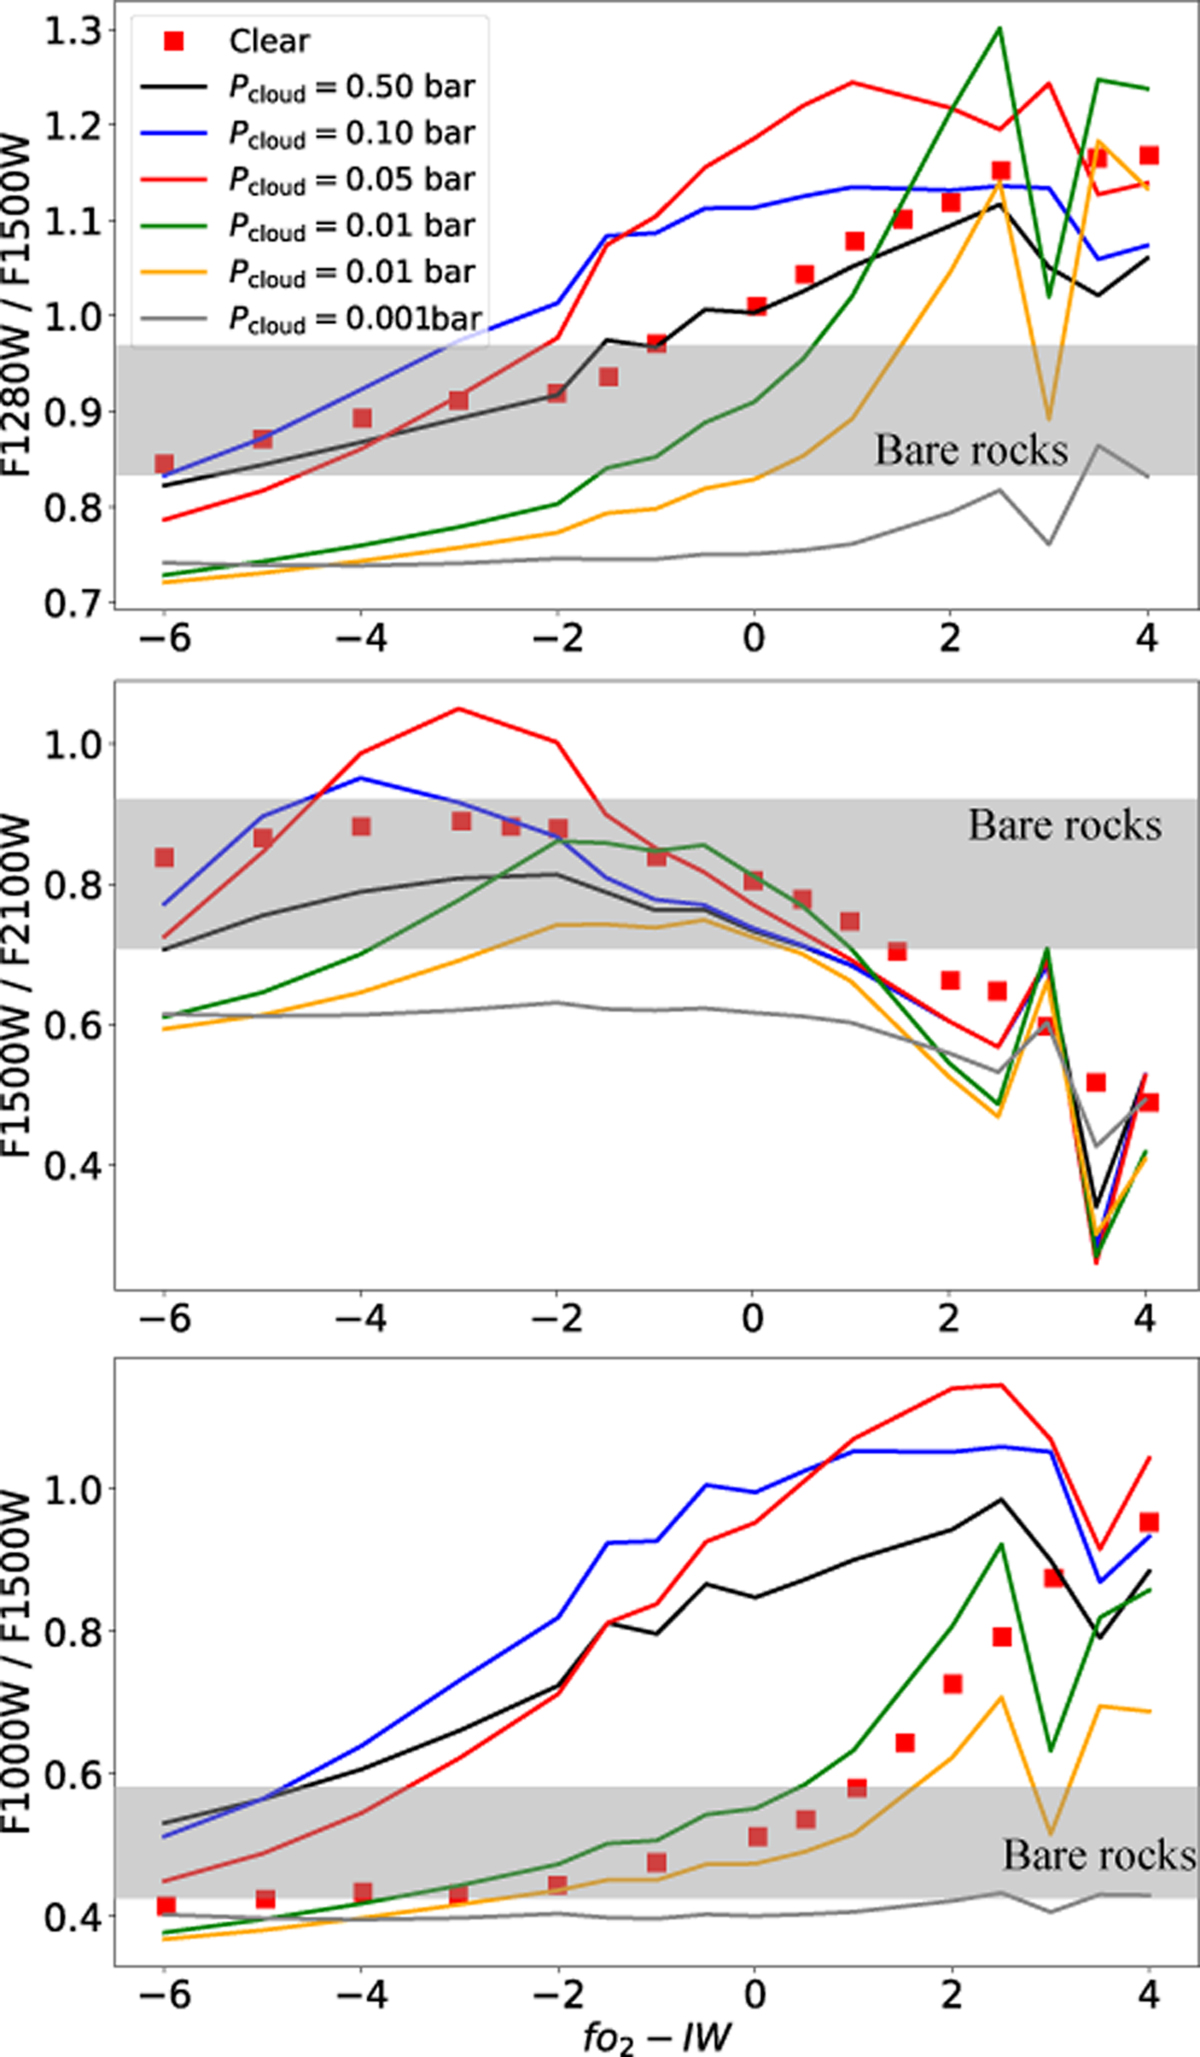
Fig. 17
Download original image
Gray cloud effects in the spectral indexes introduced in Figure 13. With red squares we show the clear atmospheric scenario and with colored lines the gray cloud deck at various pressure levels. With the shadowed gray area, we show the 1σ variation of all the bare rock scenarios simulated in this work. The example shown is the 1 bar surface pressure at various oxidation states for ac = 10−6. With this figure we emphasize that gray clouds introduce degeneracies between bare rocks and atmospheres even for highly oxidized atmospheres.
Current usage metrics show cumulative count of Article Views (full-text article views including HTML views, PDF and ePub downloads, according to the available data) and Abstracts Views on Vision4Press platform.
Data correspond to usage on the plateform after 2015. The current usage metrics is available 48-96 hours after online publication and is updated daily on week days.
Initial download of the metrics may take a while.