Fig. 18
Download original image
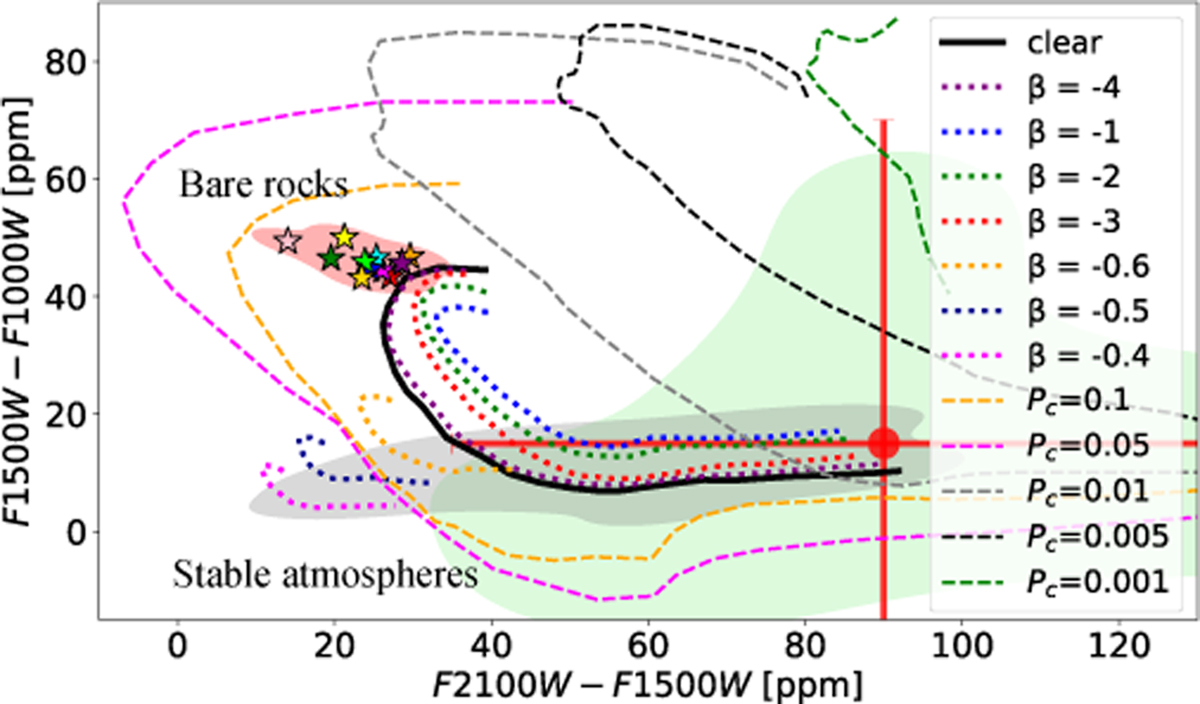
Proposed color-color diagram including the effects of cloud and hazes. The black solid line gives the mean value of the atmospheric scenarios shown in Figure 14 and the colored stars and pink shaded area are the same as in Figure 14. With dotted colored lines we show the effects of β factor from −4 to −0.4 and with gray shadowed region their combined KDE for the stable atmospheres. With dashed colored curves the limit of β → 0 is shown which represents the effect of gray clouds at various pressure layers and the green shaded area is the KDE of the combined gray cloud stable atmospheres scenarios. For reference, a red point with error bars is overplotted, representing the expected observational uncertainty based on propagated errors from the JWST/MIRI secondary eclipse setup proposed by Benneke et al. (2024). This serves as a benchmark for evaluating the extent to which different scenarios are observationally distinguishable given current instrumental capabilities.
Current usage metrics show cumulative count of Article Views (full-text article views including HTML views, PDF and ePub downloads, according to the available data) and Abstracts Views on Vision4Press platform.
Data correspond to usage on the plateform after 2015. The current usage metrics is available 48-96 hours after online publication and is updated daily on week days.
Initial download of the metrics may take a while.