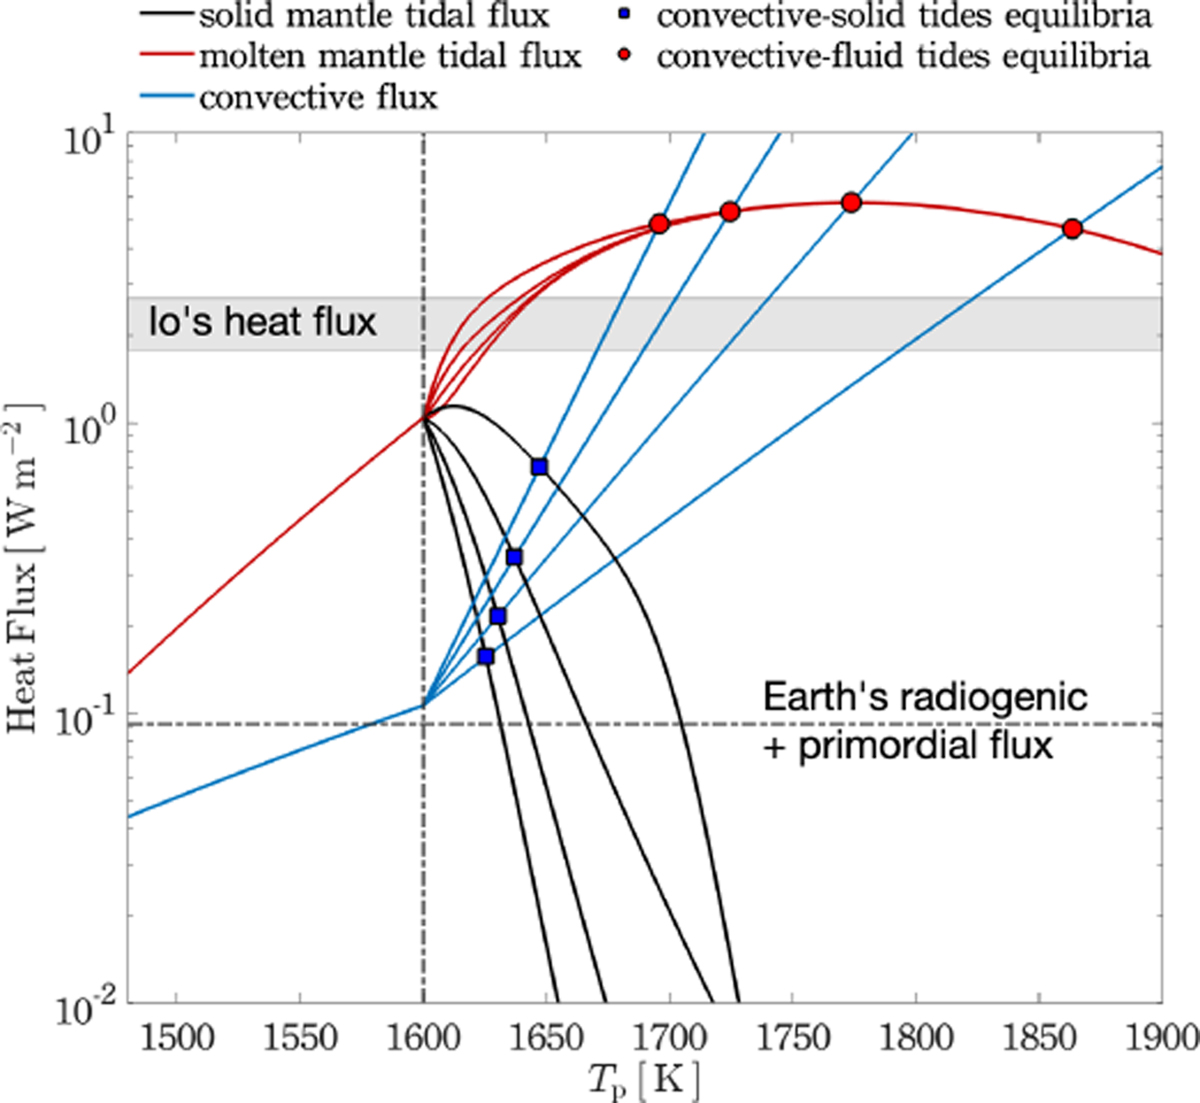
Fig. 2
Download original image
Modeled internal energy balance for LP 791-18 d. Plotted are convective (blue curves) and tidal (black and red curves) heat fluxes as a function of the mantle’s potential temperature. The isothermal mantle solidus is set at Tp = 1600 K. We follow the prescription of Peterson et al. (2023) and use the same parameters therein to compute: i) the convective flux assuming soft turbulence in the mantle (e.g., Solomatov 2015), whereby the four sets of curves cover a range of melt fraction coefficients (B = 10, 20, 30, and 40); and ii) the tidal heating flux of a Maxwell viscoelastic solid mantle. In addition, we compute the tidal heat flux allowing for the fluid contribution of melt in the mantle, following Farhat et al. (2025), using a conservative estimate of the dissipative timescale, σR = 10−3 s−1. Interior thermal equilibria, corresponding to the balance between tidal heating and convective cooling, are shown by the colored markers.
Current usage metrics show cumulative count of Article Views (full-text article views including HTML views, PDF and ePub downloads, according to the available data) and Abstracts Views on Vision4Press platform.
Data correspond to usage on the plateform after 2015. The current usage metrics is available 48-96 hours after online publication and is updated daily on week days.
Initial download of the metrics may take a while.