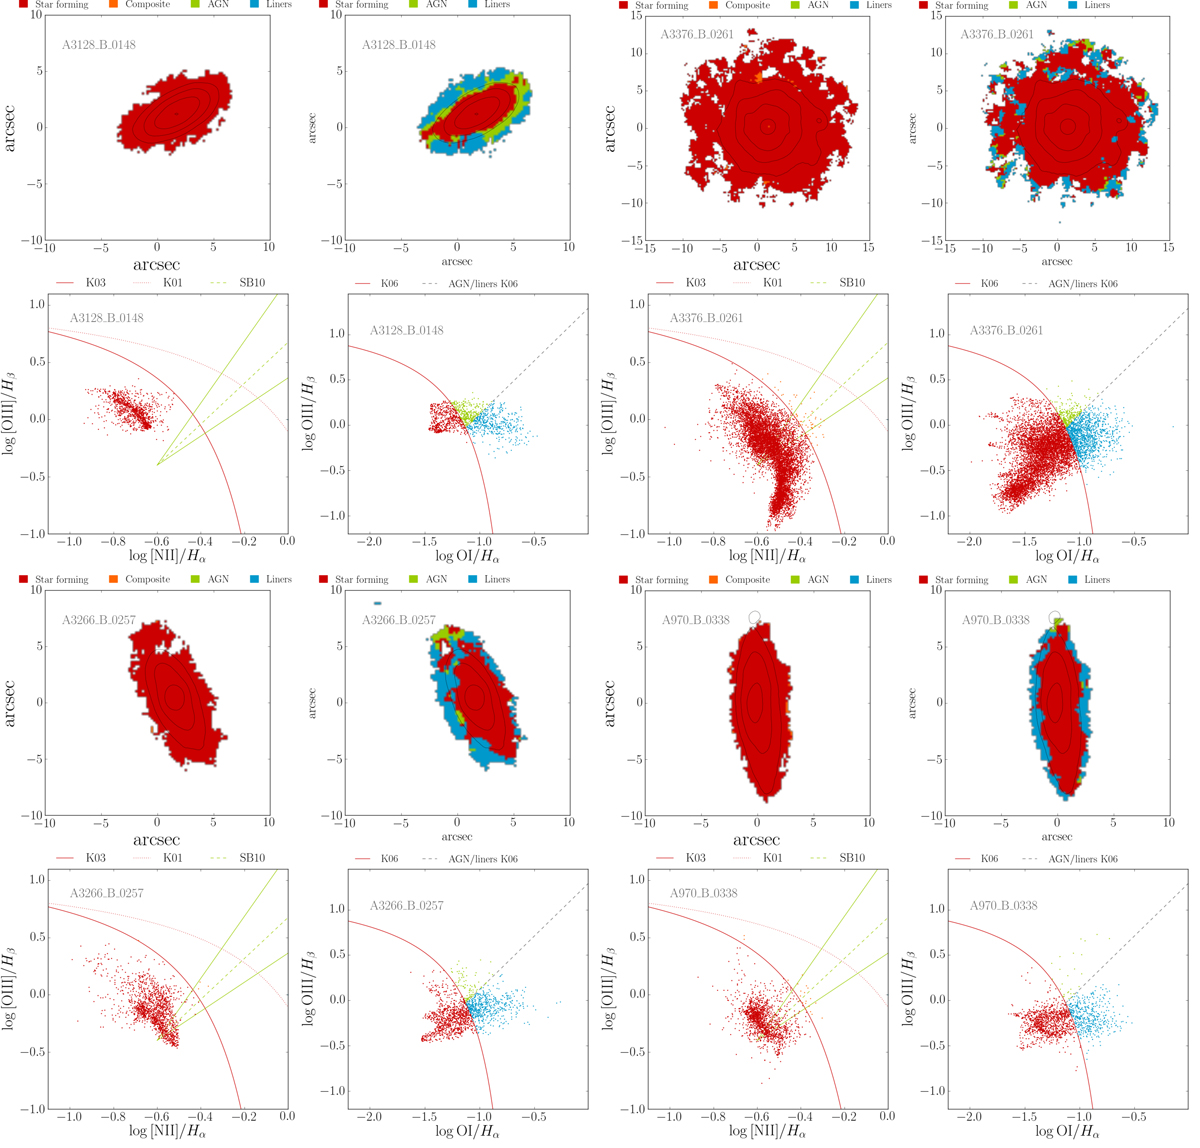
Fig. 10.
Download original image
Diagnostic diagrams for [O III]5007/Hβ vs. [N II]6583/Hα and [OI]6300/Hα for the control sample galaxies. For each galaxy, the top panel shows the BPT line-ratio map, while the bottom panel shows the corresponding spatially resolved BPT diagram. Lines are included from Kauffmann et al. (2003, K03), Kewley et al. (2001, K01), and Sharp & Bland-Hawthorn (2010, SB10) to separate star-forming (red), composite (orange), AGN (green), and LINER (cyan) galaxies. Only spaxels with a S/N > 3 in all of the emission lines involved are shown. Adopting a S/N > 4 does not modify these plots.
Current usage metrics show cumulative count of Article Views (full-text article views including HTML views, PDF and ePub downloads, according to the available data) and Abstracts Views on Vision4Press platform.
Data correspond to usage on the plateform after 2015. The current usage metrics is available 48-96 hours after online publication and is updated daily on week days.
Initial download of the metrics may take a while.